- ▶
- Heaters/Source
- ▶
- Agilent Heaters and SensorsMass Spectrometry, Scientific Supplies & ManufacturingScientific Instrument Services 5973 Source Heater Tamper Resistant Allen Wrench 5973/5975 Quad Sensor 5985 Source Heater Assembly Agilent Interface Heater Assembly 5971 Interface Heater

- ▶
- Reference Material on InstrumentationArticle - A High Temperature Direct Probe for a Mass Spectrometer Design of a Direct Exposure Probe and Controller for use ona Hewlett-Packard 5989 Mass Spectrometer SIS AP1000 AutoProbe™ SIS AP2000 AutoProbe™ - Description of System HPP7: Direct Probe Electronics Console HPP7: Direct Probe for the Agilent (HP) 5973/5975 MSD HPP7: HP Direct Probe Application Notes HPP7: Installation Directions for the Direct Probe HPP7: Side Cover for the HP 5973 MSD HPP7: Support HPP7: Probe Inlet System for the Agilent (HP) 5973 and 5975 MSD with Automatic Indexed Stops HPP7: Theory of Operation of the Direct Probe and Probe Inlet System Direct Thermal Extraction Thermal Desorption Application Notes Environmental Thermal Desorption Application Notes Food Science Thermal Desorption Application Notes Forensic Thermal Desorption Application Notes GC Cryo-Trap Application Notes Headspace Application Notes Purge & Trap Thermal Desorption Application Notes Theory of Operation of the AutoDesorb® System AutoDesorb Notes for SIS Dealers Adsorbent Resin Application Notes Installation of the Short Path Thermal Desorption System on Agilent (HP) and Other GCs Installation of the Short Path Thermal Desorption System on a Varian 3400 GC AutoDesorb® System Development Team Thermal Desorption Applications and Reference Materials Installation of the Short Path Thermal Desorption System - TD5 Part I - Design & Operation of the Short Path ThermalDesorption System Installation Instructions for the Model 951 GC Cryo-Trap on the HP 5890 Series GC Installation Instructions for the Model 961 GC Cryo-Trap on the HP 5890 Series GC Operation of the Model 951/961 GC Cryo-Trap SIS GC Cryo Traps - Theory of Operation NIST/EPA/NIH Mass Spectral Enhancements - 1998 version (NIST98) SIMION 3D Ion Optics Class Mass Spectrometer Source Cleaning Methods MS Tip: Mass Spectrometer Source Cleaning Procedures Mass Spec Source Cleaning Procedures Micro-Mesh® Abrasive Sheets Research Papers Using New Era Syringe Pump Systems EI Positive Ion Spectra for Perfluorokerosene (PFK) Cap Liner Information How do I convert between fluid oz and milliliters? Which bottle material should I choose? Which bottle mouth should I choose? The Bottle Selection Guide CGA Connections for Gas Tanks Chemical Reaction Interface Mass Spectrometry (CRIMS)

- TD
- ▶
- AccessoriesTD Supply Kit Desorption Tubes Adsorbent Resins Desorption Tube Needles Desorption Tube Seals Desorption System Fittings GC Cryo-Trap Extraction Cell TD Sample Loader Prepacked, Conditioned Desorption Tubes Desorption Tube Packing Accessories Stainless Steel Purge Heads Injection Port Liners Tenax TA Poster TD Application Notes Customer Service

- LiteratureApplication Notes Adsorbent Resins Guide Mass Spec Tips SDS Sheets FAQ MS Calibration Compound Spectra Manuals MS Links/Labs/ Organizations MS Online Tools Flyers on Products/Services Scientific Supplies Catalog About Us NextAdvance Bullet Blender® Homogenizer Protocols Micro-Mesh® Literature Instrumentation Literature Agilent GC/MS Literature SIS News / E-Mail Newsletter NIST MS Database - Update Notifications
- ▶
- Thermal Desorption Applications and Reference MaterialsDirect Thermal Extraction Headspace Environmental Food Science Applications Pharmaceuticals Forensic Note 103: EPA Method 325B, Novel Thermal Desorption Instrument Modification to Improve Sensitivity Note 102: Identification of Contaminants in Powdered Beverages by Direct Extraction Thermal Desorption GC/MS Note 101: Identification of Contaminants in Powdered Foods by Direct Extraction Thermal Desorption GC/MS Note 100: Volatile and Semi-Volatile Profile Comparison of Whole Versus Cracked Versus Dry Homogenized Barley Grains by Direct Thermal Extraction Note 99: Volatile and Semi-Volatile Profile Comparison of Whole vs. Dry Homogenized Wheat, Rye and Barley Grains by Direct Thermal Extraction GC/MS Note 98: Flavor and Aroma Profiles of Truffle Oils by Thermal Desorption GC/MS Note 97: Flavor Profiles of Imported and Domestic Beers by Purge & Trap Thermal Desorption GC/MS Note 95: Detection of Explosives on Clothing Material by Direct and AirSampling Thermal Desorption GC/MS Note 94: Detection of Nepetalactone in the Nepeta Cataria Plant by Thermal Desorption GC/MS Note 93: Detection of Benzene in Carbonated Beverages with Purge & Trap Thermal Desorption GC/MS Note 88: Analysis of Silicone Contaminants on Electronic Components by Thermal Desorption GC-MS Note 84: Vacuum Pump Exhaust Filters - Charcoal Exhaust Traps Note 83: Vacuum Pump Exhaust Filters - Oil Mist Eliminators Note 82: Vacuum Pump Exhaust Filters Note 80: Design, Development and Testing of a Microprocessor ControlledAutomated Short Path Thermal Desorption Apparatus Note 79: Volatile Organic Compounds From Electron Beam Cured and Partially Electron Beam Cured Packaging Using Automated Short Path Thermal Desorption Note 77: The Determination of Volatile Organic Compounds in VacuumSystem Components Note 75: An Apparatus for Sampling Volatile Organics From LivePlant Material Using Short Path Thermal Desorption Note 73: The Analysis of Perfumes and their Effect on Indoor Air Pollution Note 71: Flavor Profile Determination of Rice Samples Using Shor tPath Thermal Desorption GC Methods Note 65: Determination of Ethylene by Adsorbent Trapping and Thermal Desorption - Gas Chromatography Note 64: Comparison of Various GC/MS Techniques For the Analysis of Black Pepper (Piper Nigrum) Note 63: Determination of Volatile and Semi-Volatile Organics in Printer Toners Using Thermal Desorption GC Techniques Note 60: Programmable Temperature Ramping of Samples Analyzed ViaDirect Thermal Extraction GC/MS Note 57: Aroma Profiles of Lavandula species Note 55: Seasonal Variation in Flower Volatiles Note 54: Identification of Volatile Organic Compounds in Office Products Note 43: Volatile Organic Composition In Blueberries Note 42: The Influence of Pump Oil Purity on Roughing Pumps Note 41: Hydrocarbon Production in Pine by Direct Thermal Extraction Note 40: Comparison of Septa by Direct Thermal Extraction Note 39: Comparison of Sensitivity Of Headspace GC, Purge and Trap Thermal Desorption and Direct Thermal Extraction Techniques For Volatile Organics Note 38: A New Micro Cryo-Trap For Trapping Of Volatiles At the Front Of a GC Capillary Column Note 37: Volatile Organic Emissions from Automobile Tires Note 36: Identification Of Volatile Organic Compounds In a New Automobile Note 35: Volatile Organics Composition of Cranberries Note 34: Selection Of Thermal Desorption and Cryo-Trap Parameters In the Analysis Of Teas Note 33: Changes in Volatile Organic Composition in Milk Over Time Note 32: Selection and Use of Adsorbent Resins for Purge and Trap Thermal Desorption Applications Note 31: Volatile Organic Composition in Several Cultivars of Peaches Note 30: Comparison Of Cooking Oils By Direct Thermal Extraction and Purge and Trap GC/MS Note 29: Analysis Of Volatile Organics In Oil Base Paints By Automated Headspace Sampling and GC Cryo-Focusing Note 28: Analysis Of Volatile Organics In Latex Paints By Automated Headspace Sampling and GC Cryo-Focusing Note 27: Analysis of Volatile Organics In Soils By Automated Headspace GC Note 26: Volatile Organics Present in Recycled Air Aboard a Commercial Airliner Note 25: Flavor and Aroma in Natural Bee Honey Note 24: Selection of GC Guard Columns For Use With the GC Cryo-Trap Note 23: Frangrance Qualities in Colognes Note 22: Comparison Of Volatile Compounds In Latex Paints Note 21: Detection and Identification Of Volatile and Semi-Volatile Organics In Synthetic Polymers Used In Food and Pharmaceutical Packaging Note 20: Using Direct Thermal Desorption to Assess the Potential Pool of Styrene and 4-Phenylcyclohexene In Latex-Backed Carpets Note 19: A New Programmable Cryo-Cooling/Heating Trap for the Cryo-Focusing of Volatiles and Semi-Volatiles at the Head of GC Capillary Columns Note 18: Determination of Volatile Organic Compounds In Mushrooms Note 17: Identification of Volatile Organics in Wines Over Time Note 16: Analysis of Indoor Air and Sources of Indoor Air Contamination by Thermal Desorption Note 14: Identification of Volatiles and Semi-Volatiles In Carbonated Colas Note 13: Identification and Quantification of Semi-Volatiles In Soil Using Direct Thermal Desorption Note 12: Identification of the Volatile and Semi-Volatile Organics In Chewing Gums By Direct Thermal Desorption Note 11: Flavor/Fragrance Profiles of Instant and Ground Coffees By Short Path Thermal Desorption Note 10: Quantification of Naphthalene In a Contaminated Pharmaceutical Product By Short Path Thermal Desorption Note 9: Methodologies For the Quantification Of Purge and Trap Thermal Desorption and Direct Thermal Desorption Analyses Note 8: Detection of Volatile Organic Compounds In Liquids Utilizing the Short Path Thermal Desorption System Note 7: Chemical Residue Analysis of Pharmaceuticals Using The Short Path Thermal Desorption System Note 6: Direct Thermal Analysis of Plastic Food Wraps Using the Short Path Thermal Desorption System Note 5: Direct Thermal Analysis Using the Short Path Thermal Desorption System Note 4: Direct Analysis of Spices and Coffee Note 3: Indoor Air Pollution Note 2: Detection of Arson Accelerants Using Dynamic Headspace with Tenax® Cartridges Thermal Desorption and Cryofocusing Note 1: Determination of Off-Odors and Other Volatile Organics In Food Packaging Films By Direct Thermal Analysis-GC-MS
- ▶
- Food Science Thermal Desorption Application NotesNote 102: Identification of Contaminants in Powdered Beverages by Direct Extraction Thermal Desorption GC/MS Note 101: Identification of Contaminants in Powdered Foods by Direct Extraction Thermal Desorption GC/MS Note 98: Flavor and Aroma Profiles of Truffle Oils by Thermal Desorption GC/MS Note 93: Detection of Benzene in Carbonated Beverages with Purge & Trap Thermal Desorption GC/MS Note 43: Volatile Organic Composition In Blueberries Note 41: Hydrocarbon Production in Pine by Direct Thermal Extraction Note 35: Volatile Organics Composition of Cranberries Note 33: Changes in Volatile Organic Composition in Milk Over Time Note 31: Volatile Organic Composition in Several Cultivars of Peaches Note 30: Comparison Of Cooking Oils By Direct Thermal Extraction and Purge and Trap GC/MS Note 25: Flavor and Aroma in Natural Bee Honey Note 21: Detection and Identification Of Volatile and Semi-Volatile Organics In Synthetic Polymers Used In Food and Pharmaceutical Packaging Note 18: Determination of Volatile Organic Compounds In Mushrooms Note 17: Identification of Volatile Organics in Wines Over Time Note 14: Identification of Volatiles and Semi-Volatiles In Carbonated Colas Note 12: Identification of the Volatile and Semi-Volatile Organics In Chewing Gums By Direct Thermal Desorption Note 11: Flavor/Fragrance Profiles of Instant and Ground Coffees By Short Path Thermal Desorption Note 9: Methodologies For the Quantification Of Purge and Trap Thermal Desorption and Direct Thermal Desorption Analyses Note 8: Detection of Volatile Organic Compounds In Liquids Utilizing the Short Path Thermal Desorption System Note 6: Direct Thermal Analysis of Plastic Food Wraps Using the Short Path Thermal Desorption System Note 5: Direct Thermal Analysis Using the Short Path Thermal Desorption System Note 4: Direct Analysis of Spices and Coffee Note 1: Determination of Off-Odors and Other Volatile Organics In Food Packaging Films By Direct Thermal Analysis-GC-MS
- Purge & Trap Thermal Desorption Application NotesNote 97: Flavor Profiles of Imported and Domestic Beers by Purge & Trap Thermal Desorption GC/MS Note 93: Detection of Benzene in Carbonated Beverages with Purge & Trap Thermal Desorption GC/MS Note 43: Volatile Organic Composition In Blueberries Note 42: The Influence of Pump Oil Purity on Roughing Pumps Note 38: A New Micro Cryo-Trap For Trapping Of Volatiles At the Front Of a GC Capillary Column Note 35: Volatile Organics Composition of Cranberries Note 34: Selection Of Thermal Desorption and Cryo-Trap Parameters In the Analysis Of Teas Note 33: Changes in Volatile Organic Composition in Milk Over Time Note 32: Selection and Use of Adsorbent Resins for Purge and Trap Thermal Desorption Applications Note 31: Volatile Organic Composition in Several Cultivars of Peaches Note 30: Comparison Of Cooking Oils By Direct Thermal Extraction and Purge and Trap GC/MS Note 26: Volatile Organics Present in Recycled Air Aboard a Commercial Airliner Note 25: Flavor and Aroma in Natural Bee Honey Note 23: Frangrance Qualities in Colognes Note 22: Comparison Of Volatile Compounds In Latex Paints Note 21: Detection and Identification Of Volatile and Semi-Volatile Organics In Synthetic Polymers Used In Food and Pharmaceutical Packaging Note 20: Using Direct Thermal Desorption to Assess the Potential Pool of Styrene and 4-Phenylcyclohexene In Latex-Backed Carpets Note 18: Determination of Volatile Organic Compounds In Mushrooms Note 17: Identification of Volatile Organics in Wines Over Time Note 16: Analysis of Indoor Air and Sources of Indoor Air Contamination by Thermal Desorption Note 14: Identification of Volatiles and Semi-Volatiles In Carbonated Colas Note 8: Detection of Volatile Organic Compounds In Liquids Utilizing the Short Path Thermal Desorption System Note 3: Indoor Air Pollution Note 2: Detection of Arson Accelerants Using Dynamic Headspace with Tenax® Cartridges Thermal Desorption and Cryofocusing
- Application NotesNote 103: EPA Method 325B, Novel Thermal Desorption Instrument Modification to Improve Sensitivity Note 102: Identification of Contaminants in Powdered Beverages by Direct Extraction Thermal Desorption GC/MS Note 101: Identification of Contaminants in Powdered Foods by Direct Extraction Thermal Desorption GC/MS Note 100: Volatile and Semi-Volatile Profile Comparison of Whole Versus Cracked Versus Dry Homogenized Barley Grains by Direct Thermal Extraction Note 99: Volatile and Semi-Volatile Profile Comparison of Whole vs. Dry Homogenized Wheat, Rye and Barley Grains by Direct Thermal Extraction GC/MS Note 98: Flavor and Aroma Profiles of Truffle Oils by Thermal Desorption GC/MS Note 97: Flavor Profiles of Imported and Domestic Beers by Purge & Trap Thermal Desorption GC/MS Note 96: Reducing Warping in Mass Spectrometer Filaments, with SISAlloy® Yttria/Rhenium Filaments Note 95: Detection of Explosives on Clothing Material by Direct and AirSampling Thermal Desorption GC/MS Note 94: Detection of Nepetalactone in the Nepeta Cataria Plant by Thermal Desorption GC/MS Note 93: Detection of Benzene in Carbonated Beverages with Purge & Trap Thermal Desorption GC/MS Note 92: Yttria Coated Mass Spectrometer Filaments Note 91: AutoProbe DEP Probe Tip Temperatures Note 90: An Automated MS Direct Probe for use in an Open Access Environment Note 89: Quantitation of Organics via a Mass Spectrometer Automated Direct Probe Note 88: Analysis of Silicone Contaminants on Electronic Components by Thermal Desorption GC-MS Note 87: Design and Development of an Automated Direct Probe for a Mass Spectrometer Note 86: Simulation of a Unique Cylindrical Quadrupole Mass Analyzer Using SIMION 7.0. Note 85: Replacing an Electron Multiplier in the Agilent (HP) 5973 MSD Note 84: Vacuum Pump Exhaust Filters - Charcoal Exhaust Traps Note 83: Vacuum Pump Exhaust Filters - Oil Mist Eliminators Note 82: Vacuum Pump Exhaust Filters Note 81: Rapid Bacterial Chemotaxonomy By DirectProbe/MSD Note 80: Design, Development and Testing of a Microprocessor ControlledAutomated Short Path Thermal Desorption Apparatus Note 79: Volatile Organic Compounds From Electron Beam Cured and Partially Electron Beam Cured Packaging Using Automated Short Path Thermal Desorption Note 78: A New Solution to Eliminate MS Down-Time With No-Tool-Changing of Analytical GC Columns Note 77: The Determination of Volatile Organic Compounds in VacuumSystem Components Note 76: Determination of the Sensitivity of a CRIMS System Note 75: An Apparatus for Sampling Volatile Organics From LivePlant Material Using Short Path Thermal Desorption Note 74: Examination of Source Design in Electrospray-TOF Using SIMION 3D Note 73: The Analysis of Perfumes and their Effect on Indoor Air Pollution Note 72: 1998 Version of the NIST/EPA/NIH Mass Spectral Library, NIST98 Note 71: Flavor Profile Determination of Rice Samples Using Shor tPath Thermal Desorption GC Methods Note 70: Application of SIMION 6.0 To a Study of the Finkelstein Ion Source: Part II Note 69: Application of SIMION 6.0 To a Study of the Finkelstein Ion Source: Part 1 Note 68: Use of a PC Plug-In UV-Vis Spectrometer To Monitor the Plasma Conditions In GC-CRIMS Note 67: Using Chemical Reaction Interface Mass Spectrometry (CRIMS) To Monitor Bacterial Transport In In Situ Bioremediation Note 66: Probe Tip Design For the Optimization of Direct Insertion Probe Performance Note 65: Determination of Ethylene by Adsorbent Trapping and Thermal Desorption - Gas Chromatography Note 64: Comparison of Various GC/MS Techniques For the Analysis of Black Pepper (Piper Nigrum) Note 63: Determination of Volatile and Semi-Volatile Organics in Printer Toners Using Thermal Desorption GC Techniques Note 62: Analysis of Polymer Samples Using a Direct Insertion Probe and EI Ionization Note 61: Analysis of Sugars Via a New DEP Probe Tip For Use With theDirect Probe On the HP5973 MSD Note 60: Programmable Temperature Ramping of Samples Analyzed ViaDirect Thermal Extraction GC/MS Note 59: Computer Modeling of a TOF Reflectron With Gridless Reflector Using SIMION 3D Note 58: Direct Probe Analysis and Identification of Multicomponent Pharmaceutical Samples via Electron Impact MS Note 57: Aroma Profiles of Lavandula species Note 56: Mass Spec Maintenance & Cleaning Utilizing Micro-Mesh® Abrasive Sheets Note 55: Seasonal Variation in Flower Volatiles Note 54: Identification of Volatile Organic Compounds in Office Products Note 53: SIMION 3D v6.0 Ion Optics Simulation Software Note 52: Computer Modeling of Ion Optics in Time-of-Flight mass Spectrometry Using SIMION 3D Note 51: Development and Characterization of a New Chemical Reaction Interface for the Detection of Nonradioisotopically Labeled Analytes Using Mass Spectrometry (CRIMS) Note 50: The Analysis of Multiple Component Drug Samples Using a Direct Probe Interfaced to the HP 5973 MSD Note 49: Analysis of Cocaine Utilizing a New Direct Insertion Probe on a Hewlett Packard 5973 MSD Note 48: Demonstration of Sensitivity Levels For the Detection of Caffeine Using a New Direct Probe and Inlet for the HP 5973 MSD Note 47: The Application Of SIMION 6.0 To Problems In Time-of-Flight Mass Spectrometry Note 46: Delayed Extraction and Laser Desorption: Time-lag Focusing and Beyond Note 45: Application of SIMION 6.0 to Filament Design for Mass Spectrometer Ionization Sources Note 44: The Design Of a New Direct Probe Inlet For a Mass Spectrometer Note 43: Volatile Organic Composition In Blueberries Note 42: The Influence of Pump Oil Purity on Roughing Pumps Note 41: Hydrocarbon Production in Pine by Direct Thermal Extraction Note 40: Comparison of Septa by Direct Thermal Extraction Note 39: Comparison of Sensitivity Of Headspace GC, Purge and Trap Thermal Desorption and Direct Thermal Extraction Techniques For Volatile Organics Note 38: A New Micro Cryo-Trap For Trapping Of Volatiles At the Front Of a GC Capillary Column Note 37: Volatile Organic Emissions from Automobile Tires Note 36: Identification Of Volatile Organic Compounds In a New Automobile Note 35: Volatile Organics Composition of Cranberries Note 34: Selection Of Thermal Desorption and Cryo-Trap Parameters In the Analysis Of Teas Note 33: Changes in Volatile Organic Composition in Milk Over Time Note 32: Selection and Use of Adsorbent Resins for Purge and Trap Thermal Desorption Applications Note 31: Volatile Organic Composition in Several Cultivars of Peaches Note 30: Comparison Of Cooking Oils By Direct Thermal Extraction and Purge and Trap GC/MS Note 29: Analysis Of Volatile Organics In Oil Base Paints By Automated Headspace Sampling and GC Cryo-Focusing Note 28: Analysis Of Volatile Organics In Latex Paints By Automated Headspace Sampling and GC Cryo-Focusing Note 27: Analysis of Volatile Organics In Soils By Automated Headspace GC Note 26: Volatile Organics Present in Recycled Air Aboard a Commercial Airliner Note 25: Flavor and Aroma in Natural Bee Honey Note 24: Selection of GC Guard Columns For Use With the GC Cryo-Trap Note 23: Frangrance Qualities in Colognes Note 22: Comparison Of Volatile Compounds In Latex Paints Note 21: Detection and Identification Of Volatile and Semi-Volatile Organics In Synthetic Polymers Used In Food and Pharmaceutical Packaging Note 20: Using Direct Thermal Desorption to Assess the Potential Pool of Styrene and 4-Phenylcyclohexene In Latex-Backed Carpets Note 19: A New Programmable Cryo-Cooling/Heating Trap for the Cryo-Focusing of Volatiles and Semi-Volatiles at the Head of GC Capillary Columns Note 18: Determination of Volatile Organic Compounds In Mushrooms Note 17: Identification of Volatile Organics in Wines Over Time Note 16: Analysis of Indoor Air and Sources of Indoor Air Contamination by Thermal Desorption Note 14: Identification of Volatiles and Semi-Volatiles In Carbonated Colas Note 13: Identification and Quantification of Semi-Volatiles In Soil Using Direct Thermal Desorption Note 12: Identification of the Volatile and Semi-Volatile Organics In Chewing Gums By Direct Thermal Desorption Note 11: Flavor/Fragrance Profiles of Instant and Ground Coffees By Short Path Thermal Desorption Note 10: Quantification of Naphthalene In a Contaminated Pharmaceutical Product By Short Path Thermal Desorption Note 9: Methodologies For the Quantification Of Purge and Trap Thermal Desorption and Direct Thermal Desorption Analyses Note 8: Detection of Volatile Organic Compounds In Liquids Utilizing the Short Path Thermal Desorption System Note 7: Chemical Residue Analysis of Pharmaceuticals Using The Short Path Thermal Desorption System Note 6: Direct Thermal Analysis of Plastic Food Wraps Using the Short Path Thermal Desorption System Note 5: Direct Thermal Analysis Using the Short Path Thermal Desorption System Note 4: Direct Analysis of Spices and Coffee Note 3: Indoor Air Pollution Note 2: Detection of Arson Accelerants Using Dynamic Headspace with Tenax® Cartridges Thermal Desorption and Cryofocusing Note 1: Determination of Off-Odors and Other Volatile Organics In Food Packaging Films By Direct Thermal Analysis-GC-MS Tech No. "A" Note 14: Elimination of "Memory" Peaks in Thermal Desorption Improving Sensitivity in the H.P. 5971 MSD and Other Mass Spectrometers - Part I of II Improving Sensitivity in the H.P. 5971 MSD and Other Mass Spectrometers- Part II of II Adsorbent Resins Guide Development and Field Tests of an Automated Pyrolysis Insert for Gas Chromatography. Hydrocarbon Production in Pine by Direct Thermal Extraction A New Micro Cryo-Trap for the Trapping of Volatiles at the Front of a GC Capillary (019P) - Comparison of Septa by Direct Thermal Extraction Volatile Organic Composition in Blueberry Identification of Volatile Organic Compounds in Office Products Detection and Indentification of Volatiles in Oil Base Paintsby Headspace GC with On Column Cryo-Trapping Evaluation of Septa Using a Direct Thermal Extraction Technique INFLUENCE OF STORAGE ON BLUEBERRY VOLATILES Selection of Thermal Desorption and Cryo-Trap Parameters in the Analysis of Teas Redesign and Performance of a Diffusion Based Solvent Removal Interface for LC/MS The Design of a New Direct Probe Inlet for a Mass Spectrometer Analytes Using Mass Spectrometry (CRIMS) Application of SIMION 6.0 to Filament Design for Mass Spectrometer Ionization Sources A Student Guide for SIMION Modeling Software Application of SIMION 6.0 to Problems in Time-of-flight Mass Spectrometry Comparison of Sensitivity of Headspace GC, Purge and TrapThermal Desorption and Direct Thermal Extraction Techniques forVolatile Organics The Influence of Pump Oil Purity on Roughing Pumps Analysis of Motor Oils Using Thermal Desorption-Gas Chromatography-Mass Spectrometry IDENTIFICATION OF VOLATILE ORGANIC COMPOUNDS IN PAPER PRODUCTS Computer Modeling of Ion Optics in Time-of-Flight mass Spectrometry using SIMION 3D Seasonal Variation in Flower Volatiles Development of and Automated Microprocessor Controlled Gas chromatograph Fraction Collector / Olfactometer Delayed Extraction and Laser Desorption: Time-lag Focusing and Beyond A New Micro Cryo-Trap for the Trapping of Volatiles at the Front of a GC Column Design of a Microprocessor Controlled Short Path Thermal Desorption Autosampler Computer Modeling of Ion Optics in Time-of-Flight Mass Spectrometry Using SIMION 3D Thermal Desorption Instrumentation for Characterization of Odors and Flavors
- ▶
- Note 93: Detection of Benzene in Carbonated Beverages with Purge & Trap Thermal Desorption GC/MS (This Page)

By Robert Frey, Ronald E. Shomo II and John J. Manura, Scientific Instrument Services, Ringoes, NJ (presented at Pittcon2007)
IntroductionThe recent discovery of benzene in soft drink beverages has created a firestorm of controversy within the public health, FDA, and public domain. The current FDA permissible limit for benzene in drinking water is 5 ppb.1 However; the FDA currently has no regulatory limits for benzene in beverages other than bottled water. Benzene is found in air from emissions from burning coal and oil, vapors from fossil fuels, and motor vehicle exhaust. Benzene is a known carcinogen and one of the most regulated chemicals in the world.
The recent controversy began after an independent laboratory submitted a report to the FDA in late 2005 indicating a number of commercially available soft drink beverages contained benzene in concentration levels as high as 75 ppb.1 Where was this contamination originating when the manufacturing process typically used highly filtered water to produce these beverages? One of the theories puts the blame of the elevated benzene levels on the combination of benzoate salts and ascorbic acid found in some of these drinks. The preservative sodium benzoate combined with ascorbic acid under the proper conditions (high heat and/or light exposure) has been shown to lead to the formation of benzene via the decarboxylation of benzoic acid.2
These conditions have led to another question, was the purge & trap conditions that the FDA employed contributing to the formation of benzene in these beverages? The FDA method involved the use of purge & trap GC/MS in which the samples were heated to 100°C for 30 minutes.3 Our focus in this work was to examine the effects of heat on the formation of benzene utilizing purge & trap in conjunction with a commercial thermal desorption unit coupled to a GC/MS.
Materials and MethodsThree brands of orange flavored beverages were purchased at local grocery stores for analysis. Brand X was a diet carbonated drink, Brand Y was a non-diet carbonated drink, and Brand Z was a noncarbonated non-diet drink.
Desorption tubes (4 mm stainless steel id x 4 inch) were packed with 200 mg of Tenax® TA sorbent and heat conditioned in a 24 port conditioning oven for 4 hours at 320°C with an ultra-pure Nitrogen gas purge at 25 ml/min. Tubes were removed from the heat conditioning oven then allowed to cool for 10 minutes and capped with stainless steel caps with a PTFE seal to avoid adsorption of contaminants. 300 milliliters of liquid sample was placed in a glass three neck round bottom flask connected to an Scientific Instrument Services, Inc.™ (SIS) purge and trap sampling system. Ultra-pure nitrogen gas was used to sparge the sample and a conditioned desorption tube was threaded on to the purge and trap sampling system. (Figure 1)
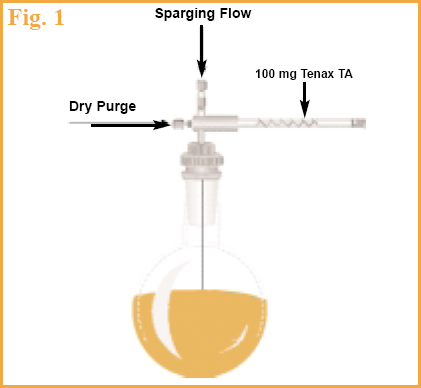
The flask containing the sample was lowered into a heated water bath for a period of 20 minutes while the nitrogen purge gas sparge was adjusted to 25 ml/minute. An equivalent dry purge gas of 25 ml/minute was blown through the gas sampling system to prevent moisture from the beverage from condensing on the sorbent bed in the desorption tube.
Samples were collected at 20, 50, and 90 °C to examine the effects of temperature on the formation of benzene. Duplicate samples of each beverage were sampled at each temperature.
The desorption tube was removed from the purge and trap sampling system and connected to a SIS ADS2000 thermal desorption system. A 35 mm desorption needle was connected to one end of the desorption tube. The needle acts as the transfer line when desorption takes place insuring the highest transfer of sample to the GC and eliminates any carryover effects observed in many other desorption systems.
The desorption tube was placed in a 12 sample holding carousel. The Thermal Desorption unit (Figure 2) picked up the desorption tube from the carousel, performed a 1 minute He purge using the GC's carrier gas, and then injected the needle through the septum of the GC injection port. After the injection port pressure stabilized, all of GC carrier gas flow was diverted through the desorption tube.
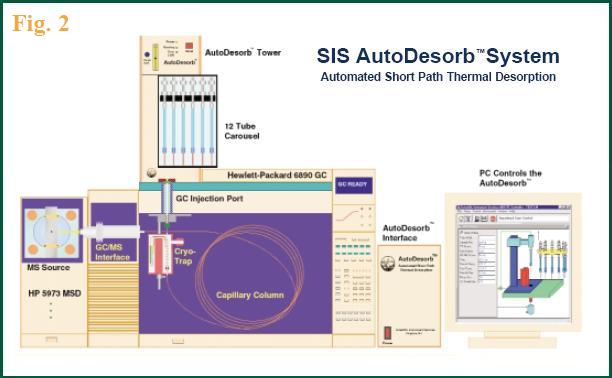
Desorption blocks heated to 150°C then closed around the desorption tube and heated the tube for 5 minutes. During the desorption process, a cryofocusing unit (SIS CryoTrap) inside the GC oven cooled a 2" section of a guard column (DB-5MS 0.53 mm ID with a 1.5 μm film thickness) to -180°C with liquid nitrogen. This trapped the desorbed compounds during the desorption process improving the chromatography by cryofocussing the components.
Thirty seconds after the desorption process was completed, the cryogenic cooling was stopped and the cryofocusing unit heated up to 200°C for 3 minutes to elute the trapped components at the head of the capillary column.
The Thermal Desorption controller then sent a remote start signal to the GC to begin the temperature ramp from 40°C to 280°C at a rate of 10°C per minute for a total GC run time of 26 minutes. The MS transfer line was held at 280°C. The GC (Agilent 6890) oven contained a capillary column HP5MS (250 μm film thickness x 0.25 mm ID x 60m length). The GC injection port was held at 280°C and the GC was run in "split" mode set at a 5:1 ratio. Total helium flow through the desorption tube was 8.8 ml/minute for the length of the 5 minute desorption run. Helium flow through the GC capillary column was 1.0ml/minute. A Mass Spectrometer (Agilent 5973MSD) was operated in Electron Impact Mode (EI) and scanned over a mass range between 35 and 500 daltons.
All analytes were identified using Agilent ChemStation software with the NIST AMDIS software using the NIST mass spec library as well as the Wiley NBS mass spec library running in the SIM mode (Selection Ion Monitoring). Quantification was performed utilizing a d6-benzene standard using the identical purge & trap method performed on the orange beverages.
Results and DiscussionAll three beverages showed the presence of benzene by this technique. Benzene levels were found to be between 0.14 pg/μl and 10.1 pg/μl. One would expect if temperature was not a factor in the production of benzene in the samples that the levels of benzene found would be the same, within experimental error, regardless of the temperature at which the samples were collected. However, the data shows a definite trend towards higher benzene concentrations at the more elevated temperatures. This can be seen most clearly for Brand Z shown in Figure 3. Brand Z had the highest levels of benzene and made this comparison easier. Also included in this figure is the blank conditioned Tenax packed desorption tube run showing no evidence of any benzene present in the adsorbent. A tabulated form of the data can be found in Table 1
| Table 1 | |||
| Sample | Purge & Trap Temperature(°C) | Benzene (pg/μl) | |
|---|---|---|---|
| X | 20 | 0.36 | |
| X | 50 | 0.60 | |
| X | 90 | 1.45 | |
| Y | 20 | 0.70 | |
| Y | 50 | 0.90 | |
| Y | 90 | 0.14 | |
| Z | 20 | 5.5 | |
| Z | 50 | 7.4 | |
| Z | 90 | 10.1 | |
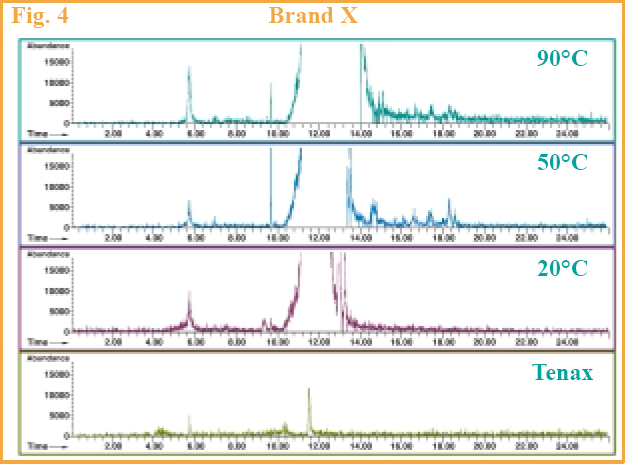
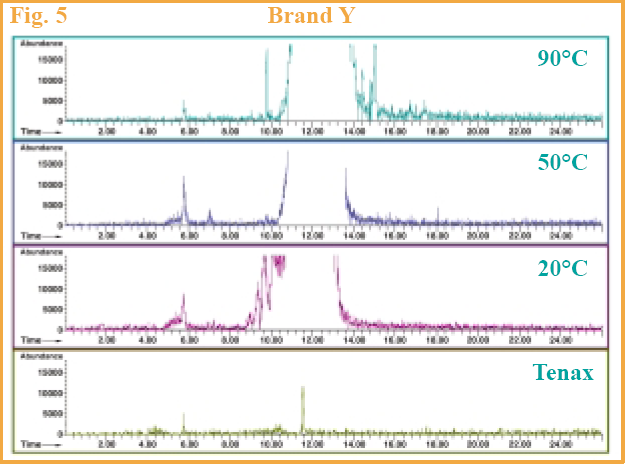
Brand X also showed an increase in benzene levels (Figure 4) with increasing temperatures but the chromatograms are less dramatic as with Brand Z. Brand Y showed an increase up to the 90 °C level (Figure 5), but at this temperature we had a difficult time keeping the lid on the flask as the pressure from the carbonation kept popping off the lid to the purge & trap sampling device, resulting in lost volatiles. This brand seemed to have more carbonation than the other brands.
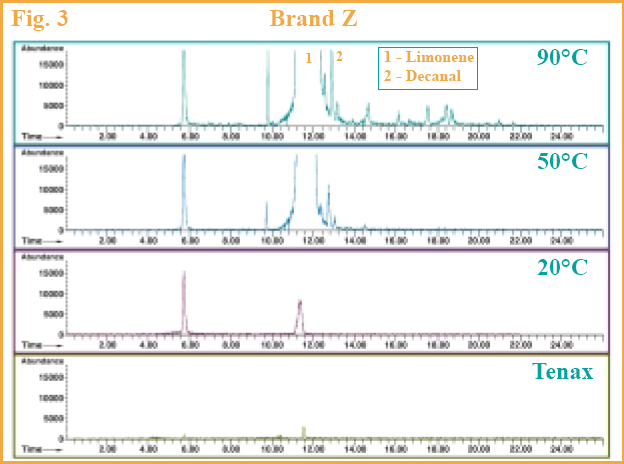
The sensitivity of the ADS2000 allows us to detect benzene at these low levels without needing to use SIM mode. This allows us to detect and identify the entire volatile and semi-volatile components present in these beverages. A couple of examples are illustrated in Figure 3. The major volatile component in this chromatogram was identified as Limonene. Decanal was also identified and is shown in the same chromatogram.
ConclusionWe have shown that there is a definite trend towards higher benzene levels found in these beverages as the temperature is increased. This is most likely a result of the previously reported decarboxylation of the benzoates in the presence of ascorbic acid to form benzene.2 This shows that one needs to be very aware in the method development stage of an analytical test, that the analysis is truly reporting the analyte of interest and not contributing to the levels of that analyte as a result of the test. There needs to be a very thorough method validation step done to insure the quality of the analytical method.
It should also be noted that since the initial independent lab report and the subsequent media blitz, many of the previously reported contaminated beverages have since changed the formulations of their products to eliminate either benzoates or ascorbic acid.
References- 1. "Data on Benzene in Soft Drinks and other Beverages", U.S. Food and Drug Administration, http://www.cfsan.fda.gov/~dms/benzdata.html . June 6, 2006.
- 2. L.K. Gardner and G.D. Lawrence, J. Agric. Fd. Chem. 1993, 41 (5), 693-695. http://dx.doi.org/10.1021/jf00029a001
- 3. "Dispute Over Benzene in Drinks", Chemical & Engineering News, April 24, 2006. http://pubs.acs.org/cen/news/84/i17/8417notw2.html