- ▶
- Heaters/Source
- ▶
- Agilent Heaters and SensorsMass Spectrometry, Scientific Supplies & ManufacturingScientific Instrument Services 5973 Source Heater Tamper Resistant Allen Wrench 5973/5975 Quad Sensor 5985 Source Heater Assembly Agilent Interface Heater Assembly 5971 Interface Heater

- ▶
- Reference Material on InstrumentationArticle - A High Temperature Direct Probe for a Mass Spectrometer Design of a Direct Exposure Probe and Controller for use ona Hewlett-Packard 5989 Mass Spectrometer SIS AP1000 AutoProbe™ SIS AP2000 AutoProbe™ - Description of System HPP7: Direct Probe Electronics Console HPP7: Direct Probe for the Agilent (HP) 5973/5975 MSD HPP7: HP Direct Probe Application Notes HPP7: Installation Directions for the Direct Probe HPP7: Side Cover for the HP 5973 MSD HPP7: Support HPP7: Probe Inlet System for the Agilent (HP) 5973 and 5975 MSD with Automatic Indexed Stops HPP7: Theory of Operation of the Direct Probe and Probe Inlet System Direct Thermal Extraction Thermal Desorption Application Notes Environmental Thermal Desorption Application Notes Food Science Thermal Desorption Application Notes Forensic Thermal Desorption Application Notes GC Cryo-Trap Application Notes Headspace Application Notes Purge & Trap Thermal Desorption Application Notes Theory of Operation of the AutoDesorb® System AutoDesorb Notes for SIS Dealers Adsorbent Resin Application Notes Installation of the Short Path Thermal Desorption System on Agilent (HP) and Other GCs Installation of the Short Path Thermal Desorption System on a Varian 3400 GC AutoDesorb® System Development Team Thermal Desorption Applications and Reference Materials Installation of the Short Path Thermal Desorption System - TD5 Part I - Design & Operation of the Short Path ThermalDesorption System Installation Instructions for the Model 951 GC Cryo-Trap on the HP 5890 Series GC Installation Instructions for the Model 961 GC Cryo-Trap on the HP 5890 Series GC Operation of the Model 951/961 GC Cryo-Trap SIS GC Cryo Traps - Theory of Operation NIST/EPA/NIH Mass Spectral Enhancements - 1998 version (NIST98) SIMION 3D Ion Optics Class Mass Spectrometer Source Cleaning Methods MS Tip: Mass Spectrometer Source Cleaning Procedures Mass Spec Source Cleaning Procedures Micro-Mesh® Abrasive Sheets Research Papers Using New Era Syringe Pump Systems EI Positive Ion Spectra for Perfluorokerosene (PFK) Cap Liner Information How do I convert between fluid oz and milliliters? Which bottle material should I choose? Which bottle mouth should I choose? The Bottle Selection Guide CGA Connections for Gas Tanks Chemical Reaction Interface Mass Spectrometry (CRIMS)

- TD
- ▶
- AccessoriesTD Supply Kit Desorption Tubes Adsorbent Resins Desorption Tube Needles Desorption Tube Seals Desorption System Fittings GC Cryo-Trap Extraction Cell TD Sample Loader Prepacked, Conditioned Desorption Tubes Desorption Tube Packing Accessories Stainless Steel Purge Heads Injection Port Liners Tenax TA Poster TD Application Notes Customer Service

- LiteratureApplication Notes Adsorbent Resins Guide Mass Spec Tips SDS Sheets FAQ MS Calibration Compound Spectra Manuals MS Links/Labs/ Organizations MS Online Tools Flyers on Products/Services Scientific Supplies Catalog About Us NextAdvance Bullet Blender® Homogenizer Protocols Micro-Mesh® Literature Instrumentation Literature Agilent GC/MS Literature SIS News / E-Mail Newsletter NIST MS Database - Update Notifications
- ▶
- Thermal Desorption Applications and Reference MaterialsDirect Thermal Extraction Headspace Environmental Food Science Applications Pharmaceuticals Forensic Note 103: EPA Method 325B, Novel Thermal Desorption Instrument Modification to Improve Sensitivity Note 102: Identification of Contaminants in Powdered Beverages by Direct Extraction Thermal Desorption GC/MS Note 101: Identification of Contaminants in Powdered Foods by Direct Extraction Thermal Desorption GC/MS Note 100: Volatile and Semi-Volatile Profile Comparison of Whole Versus Cracked Versus Dry Homogenized Barley Grains by Direct Thermal Extraction Note 99: Volatile and Semi-Volatile Profile Comparison of Whole vs. Dry Homogenized Wheat, Rye and Barley Grains by Direct Thermal Extraction GC/MS Note 98: Flavor and Aroma Profiles of Truffle Oils by Thermal Desorption GC/MS Note 97: Flavor Profiles of Imported and Domestic Beers by Purge & Trap Thermal Desorption GC/MS Note 95: Detection of Explosives on Clothing Material by Direct and AirSampling Thermal Desorption GC/MS Note 94: Detection of Nepetalactone in the Nepeta Cataria Plant by Thermal Desorption GC/MS Note 93: Detection of Benzene in Carbonated Beverages with Purge & Trap Thermal Desorption GC/MS Note 88: Analysis of Silicone Contaminants on Electronic Components by Thermal Desorption GC-MS Note 84: Vacuum Pump Exhaust Filters - Charcoal Exhaust Traps Note 83: Vacuum Pump Exhaust Filters - Oil Mist Eliminators Note 82: Vacuum Pump Exhaust Filters Note 80: Design, Development and Testing of a Microprocessor ControlledAutomated Short Path Thermal Desorption Apparatus Note 79: Volatile Organic Compounds From Electron Beam Cured and Partially Electron Beam Cured Packaging Using Automated Short Path Thermal Desorption Note 77: The Determination of Volatile Organic Compounds in VacuumSystem Components Note 75: An Apparatus for Sampling Volatile Organics From LivePlant Material Using Short Path Thermal Desorption Note 73: The Analysis of Perfumes and their Effect on Indoor Air Pollution Note 71: Flavor Profile Determination of Rice Samples Using Shor tPath Thermal Desorption GC Methods Note 65: Determination of Ethylene by Adsorbent Trapping and Thermal Desorption - Gas Chromatography Note 64: Comparison of Various GC/MS Techniques For the Analysis of Black Pepper (Piper Nigrum) Note 63: Determination of Volatile and Semi-Volatile Organics in Printer Toners Using Thermal Desorption GC Techniques Note 60: Programmable Temperature Ramping of Samples Analyzed ViaDirect Thermal Extraction GC/MS Note 57: Aroma Profiles of Lavandula species Note 55: Seasonal Variation in Flower Volatiles Note 54: Identification of Volatile Organic Compounds in Office Products Note 43: Volatile Organic Composition In Blueberries Note 42: The Influence of Pump Oil Purity on Roughing Pumps Note 41: Hydrocarbon Production in Pine by Direct Thermal Extraction Note 40: Comparison of Septa by Direct Thermal Extraction Note 39: Comparison of Sensitivity Of Headspace GC, Purge and Trap Thermal Desorption and Direct Thermal Extraction Techniques For Volatile Organics Note 38: A New Micro Cryo-Trap For Trapping Of Volatiles At the Front Of a GC Capillary Column Note 37: Volatile Organic Emissions from Automobile Tires Note 36: Identification Of Volatile Organic Compounds In a New Automobile Note 35: Volatile Organics Composition of Cranberries Note 34: Selection Of Thermal Desorption and Cryo-Trap Parameters In the Analysis Of Teas Note 33: Changes in Volatile Organic Composition in Milk Over Time Note 32: Selection and Use of Adsorbent Resins for Purge and Trap Thermal Desorption Applications Note 31: Volatile Organic Composition in Several Cultivars of Peaches Note 30: Comparison Of Cooking Oils By Direct Thermal Extraction and Purge and Trap GC/MS Note 29: Analysis Of Volatile Organics In Oil Base Paints By Automated Headspace Sampling and GC Cryo-Focusing Note 28: Analysis Of Volatile Organics In Latex Paints By Automated Headspace Sampling and GC Cryo-Focusing Note 27: Analysis of Volatile Organics In Soils By Automated Headspace GC Note 26: Volatile Organics Present in Recycled Air Aboard a Commercial Airliner Note 25: Flavor and Aroma in Natural Bee Honey Note 24: Selection of GC Guard Columns For Use With the GC Cryo-Trap Note 23: Frangrance Qualities in Colognes Note 22: Comparison Of Volatile Compounds In Latex Paints Note 21: Detection and Identification Of Volatile and Semi-Volatile Organics In Synthetic Polymers Used In Food and Pharmaceutical Packaging Note 20: Using Direct Thermal Desorption to Assess the Potential Pool of Styrene and 4-Phenylcyclohexene In Latex-Backed Carpets Note 19: A New Programmable Cryo-Cooling/Heating Trap for the Cryo-Focusing of Volatiles and Semi-Volatiles at the Head of GC Capillary Columns Note 18: Determination of Volatile Organic Compounds In Mushrooms Note 17: Identification of Volatile Organics in Wines Over Time Note 16: Analysis of Indoor Air and Sources of Indoor Air Contamination by Thermal Desorption Note 14: Identification of Volatiles and Semi-Volatiles In Carbonated Colas Note 13: Identification and Quantification of Semi-Volatiles In Soil Using Direct Thermal Desorption Note 12: Identification of the Volatile and Semi-Volatile Organics In Chewing Gums By Direct Thermal Desorption Note 11: Flavor/Fragrance Profiles of Instant and Ground Coffees By Short Path Thermal Desorption Note 10: Quantification of Naphthalene In a Contaminated Pharmaceutical Product By Short Path Thermal Desorption Note 9: Methodologies For the Quantification Of Purge and Trap Thermal Desorption and Direct Thermal Desorption Analyses Note 8: Detection of Volatile Organic Compounds In Liquids Utilizing the Short Path Thermal Desorption System Note 7: Chemical Residue Analysis of Pharmaceuticals Using The Short Path Thermal Desorption System Note 6: Direct Thermal Analysis of Plastic Food Wraps Using the Short Path Thermal Desorption System Note 5: Direct Thermal Analysis Using the Short Path Thermal Desorption System Note 4: Direct Analysis of Spices and Coffee Note 3: Indoor Air Pollution Note 2: Detection of Arson Accelerants Using Dynamic Headspace with Tenax® Cartridges Thermal Desorption and Cryofocusing Note 1: Determination of Off-Odors and Other Volatile Organics In Food Packaging Films By Direct Thermal Analysis-GC-MS
- ▶
- Pharmaceuticals Note 10: Quantification of Naphthalene In a Contaminated Pharmaceutical Product By Short Path Thermal Desorption Note 9: Methodologies For the Quantification Of Purge and Trap Thermal Desorption and Direct Thermal Desorption Analyses Note 7: Chemical Residue Analysis of Pharmaceuticals Using The Short Path Thermal Desorption System Note 5: Direct Thermal Analysis Using the Short Path Thermal Desorption System Note 1: Determination of Off-Odors and Other Volatile Organics In Food Packaging Films By Direct Thermal Analysis-GC-MS
- Food Science Thermal Desorption Application NotesNote 102: Identification of Contaminants in Powdered Beverages by Direct Extraction Thermal Desorption GC/MS Note 101: Identification of Contaminants in Powdered Foods by Direct Extraction Thermal Desorption GC/MS Note 98: Flavor and Aroma Profiles of Truffle Oils by Thermal Desorption GC/MS Note 93: Detection of Benzene in Carbonated Beverages with Purge & Trap Thermal Desorption GC/MS Note 43: Volatile Organic Composition In Blueberries Note 41: Hydrocarbon Production in Pine by Direct Thermal Extraction Note 35: Volatile Organics Composition of Cranberries Note 33: Changes in Volatile Organic Composition in Milk Over Time Note 31: Volatile Organic Composition in Several Cultivars of Peaches Note 30: Comparison Of Cooking Oils By Direct Thermal Extraction and Purge and Trap GC/MS Note 25: Flavor and Aroma in Natural Bee Honey Note 21: Detection and Identification Of Volatile and Semi-Volatile Organics In Synthetic Polymers Used In Food and Pharmaceutical Packaging Note 18: Determination of Volatile Organic Compounds In Mushrooms Note 17: Identification of Volatile Organics in Wines Over Time Note 14: Identification of Volatiles and Semi-Volatiles In Carbonated Colas Note 12: Identification of the Volatile and Semi-Volatile Organics In Chewing Gums By Direct Thermal Desorption Note 11: Flavor/Fragrance Profiles of Instant and Ground Coffees By Short Path Thermal Desorption Note 9: Methodologies For the Quantification Of Purge and Trap Thermal Desorption and Direct Thermal Desorption Analyses Note 8: Detection of Volatile Organic Compounds In Liquids Utilizing the Short Path Thermal Desorption System Note 6: Direct Thermal Analysis of Plastic Food Wraps Using the Short Path Thermal Desorption System Note 5: Direct Thermal Analysis Using the Short Path Thermal Desorption System Note 4: Direct Analysis of Spices and Coffee Note 1: Determination of Off-Odors and Other Volatile Organics In Food Packaging Films By Direct Thermal Analysis-GC-MS
- Direct Thermal Extraction Thermal Desorption Application NotesNote 103: EPA Method 325B, Novel Thermal Desorption Instrument Modification to Improve Sensitivity Note 102: Identification of Contaminants in Powdered Beverages by Direct Extraction Thermal Desorption GC/MS Note 101: Identification of Contaminants in Powdered Foods by Direct Extraction Thermal Desorption GC/MS Note 100: Volatile and Semi-Volatile Profile Comparison of Whole Versus Cracked Versus Dry Homogenized Barley Grains by Direct Thermal Extraction Note 99: Volatile and Semi-Volatile Profile Comparison of Whole vs. Dry Homogenized Wheat, Rye and Barley Grains by Direct Thermal Extraction GC/MS Note 98: Flavor and Aroma Profiles of Truffle Oils by Thermal Desorption GC/MS Note 95: Detection of Explosives on Clothing Material by Direct and AirSampling Thermal Desorption GC/MS Note 94: Detection of Nepetalactone in the Nepeta Cataria Plant by Thermal Desorption GC/MS Note 41: Hydrocarbon Production in Pine by Direct Thermal Extraction Note 40: Comparison of Septa by Direct Thermal Extraction Note 39: Comparison of Sensitivity Of Headspace GC, Purge and Trap Thermal Desorption and Direct Thermal Extraction Techniques For Volatile Organics Note 37: Volatile Organic Emissions from Automobile Tires Note 30: Comparison Of Cooking Oils By Direct Thermal Extraction and Purge and Trap GC/MS Note 21: Detection and Identification Of Volatile and Semi-Volatile Organics In Synthetic Polymers Used In Food and Pharmaceutical Packaging Note 20: Using Direct Thermal Desorption to Assess the Potential Pool of Styrene and 4-Phenylcyclohexene In Latex-Backed Carpets Note 13: Identification and Quantification of Semi-Volatiles In Soil Using Direct Thermal Desorption Note 12: Identification of the Volatile and Semi-Volatile Organics In Chewing Gums By Direct Thermal Desorption Note 11: Flavor/Fragrance Profiles of Instant and Ground Coffees By Short Path Thermal Desorption Note 10: Quantification of Naphthalene In a Contaminated Pharmaceutical Product By Short Path Thermal Desorption Note 9: Methodologies For the Quantification Of Purge and Trap Thermal Desorption and Direct Thermal Desorption Analyses Note 7: Chemical Residue Analysis of Pharmaceuticals Using The Short Path Thermal Desorption System Note 6: Direct Thermal Analysis of Plastic Food Wraps Using the Short Path Thermal Desorption System Note 5: Direct Thermal Analysis Using the Short Path Thermal Desorption System Note 4: Direct Analysis of Spices and Coffee Note 1: Determination of Off-Odors and Other Volatile Organics In Food Packaging Films By Direct Thermal Analysis-GC-MS
- Application NotesNote 103: EPA Method 325B, Novel Thermal Desorption Instrument Modification to Improve Sensitivity Note 102: Identification of Contaminants in Powdered Beverages by Direct Extraction Thermal Desorption GC/MS Note 101: Identification of Contaminants in Powdered Foods by Direct Extraction Thermal Desorption GC/MS Note 100: Volatile and Semi-Volatile Profile Comparison of Whole Versus Cracked Versus Dry Homogenized Barley Grains by Direct Thermal Extraction Note 99: Volatile and Semi-Volatile Profile Comparison of Whole vs. Dry Homogenized Wheat, Rye and Barley Grains by Direct Thermal Extraction GC/MS Note 98: Flavor and Aroma Profiles of Truffle Oils by Thermal Desorption GC/MS Note 97: Flavor Profiles of Imported and Domestic Beers by Purge & Trap Thermal Desorption GC/MS Note 96: Reducing Warping in Mass Spectrometer Filaments, with SISAlloy® Yttria/Rhenium Filaments Note 95: Detection of Explosives on Clothing Material by Direct and AirSampling Thermal Desorption GC/MS Note 94: Detection of Nepetalactone in the Nepeta Cataria Plant by Thermal Desorption GC/MS Note 93: Detection of Benzene in Carbonated Beverages with Purge & Trap Thermal Desorption GC/MS Note 92: Yttria Coated Mass Spectrometer Filaments Note 91: AutoProbe DEP Probe Tip Temperatures Note 90: An Automated MS Direct Probe for use in an Open Access Environment Note 89: Quantitation of Organics via a Mass Spectrometer Automated Direct Probe Note 88: Analysis of Silicone Contaminants on Electronic Components by Thermal Desorption GC-MS Note 87: Design and Development of an Automated Direct Probe for a Mass Spectrometer Note 86: Simulation of a Unique Cylindrical Quadrupole Mass Analyzer Using SIMION 7.0. Note 85: Replacing an Electron Multiplier in the Agilent (HP) 5973 MSD Note 84: Vacuum Pump Exhaust Filters - Charcoal Exhaust Traps Note 83: Vacuum Pump Exhaust Filters - Oil Mist Eliminators Note 82: Vacuum Pump Exhaust Filters Note 81: Rapid Bacterial Chemotaxonomy By DirectProbe/MSD Note 80: Design, Development and Testing of a Microprocessor ControlledAutomated Short Path Thermal Desorption Apparatus Note 79: Volatile Organic Compounds From Electron Beam Cured and Partially Electron Beam Cured Packaging Using Automated Short Path Thermal Desorption Note 78: A New Solution to Eliminate MS Down-Time With No-Tool-Changing of Analytical GC Columns Note 77: The Determination of Volatile Organic Compounds in VacuumSystem Components Note 76: Determination of the Sensitivity of a CRIMS System Note 75: An Apparatus for Sampling Volatile Organics From LivePlant Material Using Short Path Thermal Desorption Note 74: Examination of Source Design in Electrospray-TOF Using SIMION 3D Note 73: The Analysis of Perfumes and their Effect on Indoor Air Pollution Note 72: 1998 Version of the NIST/EPA/NIH Mass Spectral Library, NIST98 Note 71: Flavor Profile Determination of Rice Samples Using Shor tPath Thermal Desorption GC Methods Note 70: Application of SIMION 6.0 To a Study of the Finkelstein Ion Source: Part II Note 69: Application of SIMION 6.0 To a Study of the Finkelstein Ion Source: Part 1 Note 68: Use of a PC Plug-In UV-Vis Spectrometer To Monitor the Plasma Conditions In GC-CRIMS Note 67: Using Chemical Reaction Interface Mass Spectrometry (CRIMS) To Monitor Bacterial Transport In In Situ Bioremediation Note 66: Probe Tip Design For the Optimization of Direct Insertion Probe Performance Note 65: Determination of Ethylene by Adsorbent Trapping and Thermal Desorption - Gas Chromatography Note 64: Comparison of Various GC/MS Techniques For the Analysis of Black Pepper (Piper Nigrum) Note 63: Determination of Volatile and Semi-Volatile Organics in Printer Toners Using Thermal Desorption GC Techniques Note 62: Analysis of Polymer Samples Using a Direct Insertion Probe and EI Ionization Note 61: Analysis of Sugars Via a New DEP Probe Tip For Use With theDirect Probe On the HP5973 MSD Note 60: Programmable Temperature Ramping of Samples Analyzed ViaDirect Thermal Extraction GC/MS Note 59: Computer Modeling of a TOF Reflectron With Gridless Reflector Using SIMION 3D Note 58: Direct Probe Analysis and Identification of Multicomponent Pharmaceutical Samples via Electron Impact MS Note 57: Aroma Profiles of Lavandula species Note 56: Mass Spec Maintenance & Cleaning Utilizing Micro-Mesh® Abrasive Sheets Note 55: Seasonal Variation in Flower Volatiles Note 54: Identification of Volatile Organic Compounds in Office Products Note 53: SIMION 3D v6.0 Ion Optics Simulation Software Note 52: Computer Modeling of Ion Optics in Time-of-Flight mass Spectrometry Using SIMION 3D Note 51: Development and Characterization of a New Chemical Reaction Interface for the Detection of Nonradioisotopically Labeled Analytes Using Mass Spectrometry (CRIMS) Note 50: The Analysis of Multiple Component Drug Samples Using a Direct Probe Interfaced to the HP 5973 MSD Note 49: Analysis of Cocaine Utilizing a New Direct Insertion Probe on a Hewlett Packard 5973 MSD Note 48: Demonstration of Sensitivity Levels For the Detection of Caffeine Using a New Direct Probe and Inlet for the HP 5973 MSD Note 47: The Application Of SIMION 6.0 To Problems In Time-of-Flight Mass Spectrometry Note 46: Delayed Extraction and Laser Desorption: Time-lag Focusing and Beyond Note 45: Application of SIMION 6.0 to Filament Design for Mass Spectrometer Ionization Sources Note 44: The Design Of a New Direct Probe Inlet For a Mass Spectrometer Note 43: Volatile Organic Composition In Blueberries Note 42: The Influence of Pump Oil Purity on Roughing Pumps Note 41: Hydrocarbon Production in Pine by Direct Thermal Extraction Note 40: Comparison of Septa by Direct Thermal Extraction Note 39: Comparison of Sensitivity Of Headspace GC, Purge and Trap Thermal Desorption and Direct Thermal Extraction Techniques For Volatile Organics Note 38: A New Micro Cryo-Trap For Trapping Of Volatiles At the Front Of a GC Capillary Column Note 37: Volatile Organic Emissions from Automobile Tires Note 36: Identification Of Volatile Organic Compounds In a New Automobile Note 35: Volatile Organics Composition of Cranberries Note 34: Selection Of Thermal Desorption and Cryo-Trap Parameters In the Analysis Of Teas Note 33: Changes in Volatile Organic Composition in Milk Over Time Note 32: Selection and Use of Adsorbent Resins for Purge and Trap Thermal Desorption Applications Note 31: Volatile Organic Composition in Several Cultivars of Peaches Note 30: Comparison Of Cooking Oils By Direct Thermal Extraction and Purge and Trap GC/MS Note 29: Analysis Of Volatile Organics In Oil Base Paints By Automated Headspace Sampling and GC Cryo-Focusing Note 28: Analysis Of Volatile Organics In Latex Paints By Automated Headspace Sampling and GC Cryo-Focusing Note 27: Analysis of Volatile Organics In Soils By Automated Headspace GC Note 26: Volatile Organics Present in Recycled Air Aboard a Commercial Airliner Note 25: Flavor and Aroma in Natural Bee Honey Note 24: Selection of GC Guard Columns For Use With the GC Cryo-Trap Note 23: Frangrance Qualities in Colognes Note 22: Comparison Of Volatile Compounds In Latex Paints Note 21: Detection and Identification Of Volatile and Semi-Volatile Organics In Synthetic Polymers Used In Food and Pharmaceutical Packaging Note 20: Using Direct Thermal Desorption to Assess the Potential Pool of Styrene and 4-Phenylcyclohexene In Latex-Backed Carpets Note 19: A New Programmable Cryo-Cooling/Heating Trap for the Cryo-Focusing of Volatiles and Semi-Volatiles at the Head of GC Capillary Columns Note 18: Determination of Volatile Organic Compounds In Mushrooms Note 17: Identification of Volatile Organics in Wines Over Time Note 16: Analysis of Indoor Air and Sources of Indoor Air Contamination by Thermal Desorption Note 14: Identification of Volatiles and Semi-Volatiles In Carbonated Colas Note 13: Identification and Quantification of Semi-Volatiles In Soil Using Direct Thermal Desorption Note 12: Identification of the Volatile and Semi-Volatile Organics In Chewing Gums By Direct Thermal Desorption Note 11: Flavor/Fragrance Profiles of Instant and Ground Coffees By Short Path Thermal Desorption Note 10: Quantification of Naphthalene In a Contaminated Pharmaceutical Product By Short Path Thermal Desorption Note 9: Methodologies For the Quantification Of Purge and Trap Thermal Desorption and Direct Thermal Desorption Analyses Note 8: Detection of Volatile Organic Compounds In Liquids Utilizing the Short Path Thermal Desorption System Note 7: Chemical Residue Analysis of Pharmaceuticals Using The Short Path Thermal Desorption System Note 6: Direct Thermal Analysis of Plastic Food Wraps Using the Short Path Thermal Desorption System Note 5: Direct Thermal Analysis Using the Short Path Thermal Desorption System Note 4: Direct Analysis of Spices and Coffee Note 3: Indoor Air Pollution Note 2: Detection of Arson Accelerants Using Dynamic Headspace with Tenax® Cartridges Thermal Desorption and Cryofocusing Note 1: Determination of Off-Odors and Other Volatile Organics In Food Packaging Films By Direct Thermal Analysis-GC-MS Tech No. "A" Note 14: Elimination of "Memory" Peaks in Thermal Desorption Improving Sensitivity in the H.P. 5971 MSD and Other Mass Spectrometers - Part I of II Improving Sensitivity in the H.P. 5971 MSD and Other Mass Spectrometers- Part II of II Adsorbent Resins Guide Development and Field Tests of an Automated Pyrolysis Insert for Gas Chromatography. Hydrocarbon Production in Pine by Direct Thermal Extraction A New Micro Cryo-Trap for the Trapping of Volatiles at the Front of a GC Capillary (019P) - Comparison of Septa by Direct Thermal Extraction Volatile Organic Composition in Blueberry Identification of Volatile Organic Compounds in Office Products Detection and Indentification of Volatiles in Oil Base Paintsby Headspace GC with On Column Cryo-Trapping Evaluation of Septa Using a Direct Thermal Extraction Technique INFLUENCE OF STORAGE ON BLUEBERRY VOLATILES Selection of Thermal Desorption and Cryo-Trap Parameters in the Analysis of Teas Redesign and Performance of a Diffusion Based Solvent Removal Interface for LC/MS The Design of a New Direct Probe Inlet for a Mass Spectrometer Analytes Using Mass Spectrometry (CRIMS) Application of SIMION 6.0 to Filament Design for Mass Spectrometer Ionization Sources A Student Guide for SIMION Modeling Software Application of SIMION 6.0 to Problems in Time-of-flight Mass Spectrometry Comparison of Sensitivity of Headspace GC, Purge and TrapThermal Desorption and Direct Thermal Extraction Techniques forVolatile Organics The Influence of Pump Oil Purity on Roughing Pumps Analysis of Motor Oils Using Thermal Desorption-Gas Chromatography-Mass Spectrometry IDENTIFICATION OF VOLATILE ORGANIC COMPOUNDS IN PAPER PRODUCTS Computer Modeling of Ion Optics in Time-of-Flight mass Spectrometry using SIMION 3D Seasonal Variation in Flower Volatiles Development of and Automated Microprocessor Controlled Gas chromatograph Fraction Collector / Olfactometer Delayed Extraction and Laser Desorption: Time-lag Focusing and Beyond A New Micro Cryo-Trap for the Trapping of Volatiles at the Front of a GC Column Design of a Microprocessor Controlled Short Path Thermal Desorption Autosampler Computer Modeling of Ion Optics in Time-of-Flight Mass Spectrometry Using SIMION 3D Thermal Desorption Instrumentation for Characterization of Odors and Flavors
- ▶
- Note 9: Methodologies For the Quantification Of Purge and Trap Thermal Desorption and Direct Thermal Desorption Analyses (This Page)

INTRODUCTION
This manuscript describes methodologies which are useful for quantitative analyses involving purge and trap thermal desorption (P&T-TD) or direct thermal desorption (DTD) using the SIS Short Path Thermal Desorber and sample isolation accessories (1). Quantification techniques used for the determination of volatile organic compounds in water or wastewater involving P&T-TD have been extensively reviewed. These procedures form the basis of the US-EPA water and wastewater testing program and are outlined in great detail in methods #524 and 624 (2). Since this methodology has been extensively validated, it will not be reviewed in this manuscript. Rather, this discussion will address quantification problems which arise in the analysis of non-routine matrices such as foods, polymers, soils, sludges and other samples.
Analyte recoveries during purge and trap experiments can vary widely due to matrix effects, purging efficiency (volatility), purge cell design, sparging rate, choice of adsorbent, isolation temperature and many other factors. For these reasons, quantification of P&T-TD and DTD experiments are best carried out using various spiked internal standard methodologies which may offer some degree of correction for variable analyte extraction efficiency or recovery. Each individual sample matrix and analyte presents unique problems which must be overcome in order to achieve accurate and precise quantification. Analytical strategies must be formulated on an individual basis and are not always universally applicable. Intensive methods development and validation studies are required for each individual sample matrix and analyte combination to guarantee accuracy and precision in the measurements. In our laboratory, we routinely employ several different internal standard methods to achieve quantification of P& T-TD and DTD analyses. These include the standard addition, internal standard, surrogate internal standard and stable isotope labeled internal standard methods. These methods are described in this manuscript and are illustrated with examples from current research projects.
The first stage in quantitative methods development begins with designation of target compounds or analytes and choice of analysis mode. A feasibility evaluation should be conducted to determine whether or not the chosen analytes are amenable to the techniques of P&T-TD or DTD and if indeed these methodologies are the best way to conduct the investigation. The target compounds must be of sufficient volatility so that they can be efficiently sparged from the matrix and trapped on an adsorbent (P&T-TD) or be delivered directly into the GC injector using the technique DTD. In general, candidates for DTD include solid samples with low moisture contents (< 5%) and relatively high volatile organic contents (.01 - 10% w/w). Sample sizes in the range of 1-500 mg are common in this technique. However, factors such as injector split ratio and GC column loading capacity must be considered in sizing samples. Small samples are often cumbersome and difficult to accurately weigh, but are ideal for analytical separations using narrow diameter capillary columns (0.25-0.32 mm i.d.) with low loading capacities. Some compromise can be achieved by using high split ratios (100:1), which may enable larger samples to be analyzed. Maximum sample loads in the DTD technique are attainable using packed or wide bore capillary column columns, although some loss of resolution may be realized. Moisture contents of DTD samples must be low enough so they do not cause freezing and plugging of the GC column flow when operating in cryofocusing mode. Once again, high split ratios or packed and wide bore column operation will tolerate higher moisture content matrices. The advantages of the DTD technique, when permissible, are numerous. The sample requirement is small and high sensitivity is achieved. In addition, low molecular weight polar species which are not efficiently trapped by Tenax® and other common adsorbents are directly transferred to the GC for analysis and are not lost. Samples analyzed successfully by this technique include polymers, spices, candy, chewing gum, extruded snack foods, soil, wood, pine needles and other natural products. This technique has been described in detail in a previous newsletter article (3). Sample matrices which contain high moisture contents and low concentrations of flavor are best analyzed by the technique P&T-TD. In this technique, the dynamic headspace purge and trap step achieves a concentration factor, while allowing water and other low molecular weight polar species to escape the adsorbent trap. The choice of adsorbent also governs the range of analytes which can be effectively trapped. Tenax-TA resin is the most widely promoted adsorbent with various forms of activated graphitized carbons serving equally well. The particle size distribution of the activated carbons will often effect the breakthrough volumes of various analytes with smaller particles and pore sizes being more efficient for trapping highly volatile low molecular weight species. Glass beads are often used as traps to condense high boiling oligomers outgassed from polymers in high temperature desorption studies. Silica gel is also useful for trapping low molecular weight polar compounds and gasses; however, it has the disadvantage of trapping water, as well. Often, the ideal adsorbent trap may be a mixed bed design with any number and combination of these adsorbents. The next consideration is then the sample size and purge cell design. SIS manufactures a temperature controlled purge and trap apparatus specially designed for solid sample matrices as well as a range of liquid sparging vessels which can be fitted with heating accessories. In some cases, individual users may wish to construct purge and trap vessels of their own particular design. Adapters are readily available from SIS to accommodate these special requirements. In any event, it is often advantageous to set up the particular P&T-TD or DTD experiment and perform a qualitative analysis before attempting quantification. These preliminary experiments can be used to optimize the analysis with regard to sample sizing, isolation or desorption temperatures, sparge gas flow rate, chromatographic conditions and other parameters. Once all of the isolation and analysis parameters have finally been worked out on a qualitative basis, a quantification strategy must then be devised and validated. The following discussion will address specific types of internal standard methods of quantification with examples of how they have been applied in specific research projects.
STABLE ISOTOPE LABELED INTERNAL STANDARD METHODOLOGY
The stable isotope labeled internal standard method is the most accurate and precise method available for quantifying P&T-TD and DTD analyses. In this technique, a stable isotope labeled analogue is obtained for each target compound. These isotope labeled standards are then spiked into the sample matrix, isolated and analyzed. The ratio of analyte to stable isotope incorporated standard is then determined and compared to an off-line calibration or linearity curve to achieve quantification. Since their chemical and physical properties are almost exactly identical to those of the analyte, they are self correcting with respect to extraction efficiency, recovery and detector response. Of course, this method of quantification requires a mass spectrometer as a detector, since the isotope labeled standards may co-elute at the same retention time as the analyte and separation is achieved by mass chromatography or selected ion monitoring. The most common isotopes used for this purpose are 2H (deuterium) and 13 C. Companies (as MSD Isotopes and Isotech) stock thousands of stable isotope analogues, particularly those of environmental or biochemical interest. Custom synthesis services are also available upon special request. Before using a stable isotope internal standard, they must be analyzed and screened for isotope purity. Only standards with isotope purity greater than 99% are useful and for some trace level determinations purities of 99.99% are required. Next, a linear calibration curve should be constructed using a constant level of internal standard (concentration equal to the spike level in the matrix) and a varying amount of analyte. The variable analyte concentrations must cover a dynamic range sufficient to encompass the levels expected to be present in the actual sample matrices. The curve is normally constructed by plotting the ratio of analyte peak area/stable isotope labeled I.S. peak area versus concentration of analyte. The line equation for this curve can then be used to calculate an analyte concentration from the experimentally observed analyte/I.S. peak area ratio. The primary advantage of this methodology is the ability to achieve excellent accuracy and precision in the quantification. The disadvantages are the need for a mass spectrometer as detector and the high cost often associated with custom synthesis and purification of stable isotope labeled standards.
We routinely apply this method of quantification for conducting measurements of benzene, toluene and xylenes (BTOX analysis) in food products and or environmental samples. In these experiments, we spike d-6 benzene, d-8 toluene and d-10 xylene into the sample at a level approximating the concentrations of proteo analytes in the matrix. We prepare the spiking standards in methanol so that the desired spike level can be delivered to the product in a volume of 1-10 ul. Methanol is an ideal solvent for spiking standards used in P&T-TD and DTD experiments, since it is not retained by Tenax or graphitized carbon adsorbents. Therefore, the methanol passes directly through the adsorbent trap during the purge and trap step and does not cause a large peak to appear in the chromatogram which may often obscure data. The spike should be quantitatively delivered to the matrix once sealed in the purge apparatus using solvent flush technique; however, the volume of methanol used to deliver the spike should not exceed 25 ul. We have observed decreased recoveries of volatiles in purge and trap experiments when large volumes (1.0 ml or greater) of low molecular weight polar solvents are present in the matrix during isolation. Presumably, the large volume of solvent passing through the adsorbent can actually cause premature elution of components, especially the highly volatile species.
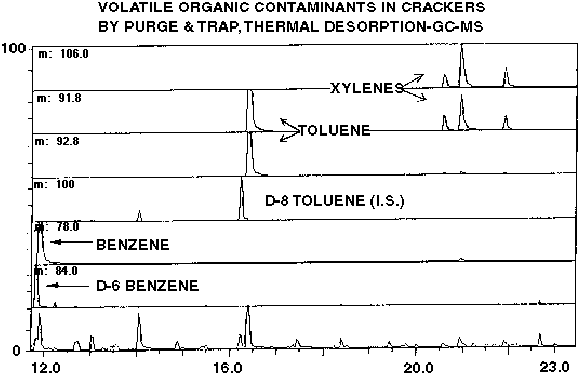
Figure 1 - GC-MS Ion Current and Mass Chromatogram of Cracker Sample Spiked With Deuterated Internal Standards For Measurement of Benzene, Toluene and Total Xylene Concentrations (BTOX Analysis)
The results of a typical P&T-TD analysis using stable isotope spiked internal standards is shown in Figure #1. This is a mass chromatogram derived from a store bought cracker product in which we were conducting a BTOX analysis. The ion masses plotted are m/z 84, 78, 100, 92 and 106 corresponding to the molecular ions of d-6 benzene, benzene, d-8 toluene, toluene and o, m, p-xylenes (no d-10 xylenes were used in this analysis). The lower trace is integrated ion current and m/z 91 corresponding to tropylium ion is also displayed. The exact spike level of d-6 benzene and d-8 toluene in this experiment was 13.2 and 14.4 ppb w/w, respectively. This analysis was conducted by P&T isolation from 10 grams of cracker crumbs using the SIS sample collection oven at 60 degrees C with Tenax/Carbotrap adsorbent with 30 minutes of sparging using nitrogen at a rate of 40 ml/minute. The adsorbent trap was then thermally desorbed at 250 degrees C for 5 minutes with subsequent analysis by GC-MS. The peak eluting just before 12 minutes yielding the large response in the m/z 84 channel is d-6 benzene. This peak is immediately followed by benzene which shows up in m/z channel 78. Similarly, d-8 toluene elutes at r.t. 16:30 at m/z 100 and is immediately followed by toluene at m/z 92. As can be seen from the data, modern analytical GC capillary columns actually achieve some separation of deutero versus proteo compounds with the deutero analogue eluting first. The ratios of deutero/proteo compounds are then used to calculate the exact concentration of each individual analyte. In this particular instance, the benzene and toluene levels in the crackers were determined to be 125 and 52 ppb, respectively. The levels of total xylenes were estimated to be 30 ppb using d-8 toluene as reference.
SURROGATE INTERNAL STANDARD METHODOLOGY
A surrogate internal standard is a matrix spiked internal standard which has chemical and physical relatedness to the analytes of interest so that extraction efficiency, recovery and detector response characteristics are similar. The surrogate standard must be a compound not normally present in the matrix. For instance, standard EPA methodology utilizes surrogate standards in its water and wastewater analysis protocols (2). They make use of fluorinated compounds which are not normally found in nature or as environmental contaminants. The EPA surrogates are available as neutral, acidic, phenolic and basic species to simulate partition behavior in conventional pH controlled extraction protocols or in purge and trap experiments. The advantages of this type of quantification are that surrogates can usually be obtained in high purities and low cost. They are useful for GC as well as GC-MS studies since the surrogates can be separated on the basis of retention time from the target compounds. Additionally, surrogates are user selectable from a wide range of chemical and physical properties which cater to specific applications. For instance, we have recently quantified vanillin and other phenolic compounds in vanilla beans by DTD using 2, 6-dimethoxyphenol as a surrogate internal standard (4). Vanillin is 4-hydroxy-3-methoxybenzaldehyde and many of the character flavor compounds of vanilla have similar phenolic functionality, so 2, 6-dimethoxyphenol was considered a good surrogate for purposes of quantification. In these analyses, vanillin samples were placed into preconditioned desorption tubes containing a 2 cm bed volume of Tenax-TA adsorbent and were then spiked with 1000 ppm of I.S.. The Tenax-TA adsorbent bed is utilized for conducting DTD analyses so that the I.S. spike and sample volatiles are not lost in the initial purge step (used to remove air) prior to thermal desorption. We constructed a calibration curve by spiking blank desorption tubes using a constant 10 ug of 2, 6-dimethoxyphenol I.S. and a varying level of vanillin (log and half-log serial dilutions from 1000-1.0 ug). A linear calibration curve was obtained with a 0.999 correlation coefficient. Excellent analytical precision was obtained. The ratio from the midpoint of the calibration curve was 0.81 (mean, n=5) with a standard deviation of 0.02 and a 2.47 coefficient of variation. Indeed, this level of precision is equal to that obtained by conventional direct injection into the GC using a syringe. Results such as these are not unusual for DTD analyses, since the technique is akin to direct injection except that the desorption tube essentially becomes a sacrificial injection port. Volatile and semivolatile components of the sample are outgassed and delivered directly into the GC injector, with nonvolatile residues remaining in the desorption tube. Figure #2 is a typical ion current chromatogram of a vanilla bean sample analyzed by DTD-GC-MS showing the I.S. , 2, 6-dimethoxyphenol, vanillin and numerous other flavor compounds. Figure #3 is the calibration curve used for the vanillin determinations. The curve was of sufficient dynamic range to encompass the vanillin concentrations detected in all samples analyzed. Vanillin contents of 1.94% observed by DTD-GC-FID and DTD-GC-MS analyses were found to be in excellent agreement with the value of 2.0% determined using traditional (but much more time consuming) extraction, isolation and HPLC analysis.
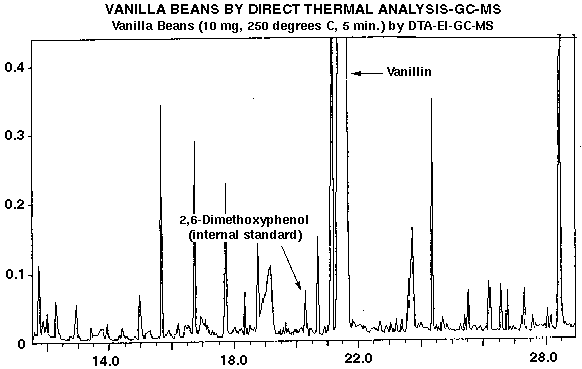
Figure 2 - GC-MS Ion Current and Mass Chromatogram of Vanilla Bean Sample Analyzed By DTD-GC-MS, Showing Internal Standard, Vanillin and Numerous Other Flavor Compounds
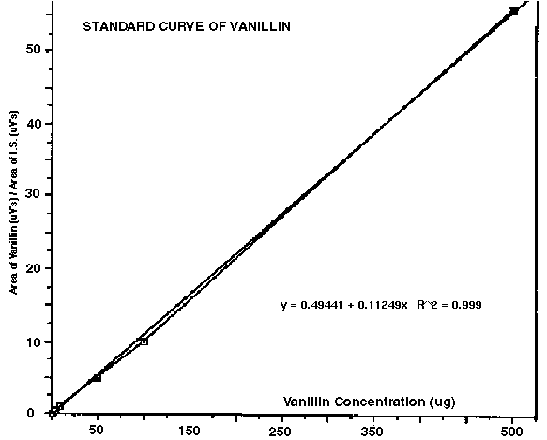
Figure 3 - Calibration Curve Generated For Quantification of Vanillin In Vanilla Beans Ising DTD-GC-MS With 2,6-Dimethoxyphenol Internal Standard
INTERNAL STANDARD METHODOLOGY
The internal standard method of quantification is useful for P&T-TD and DTD analyses, although it is somewhat less accurate than stable isotope or surrogate standard strategies. The technique is similar to those previously described with the exception that the internal standard is not incorporated into the matrix during isolation. Rather, it is spiked into the adsorbent traps, after a sample has been isolated or perhaps is injected directly into the GC at the time of desorption. Therefore, no correction for extraction efficiency or recovery is achieved using this technique. However, it serves as a useful means of quantifying the levels of components present on the adsorbent traps. As in the previous examples, it is necessary to calculate detector response factors or calibration curves for each I.S. relative to the analytes of interest. Many times this is not possible, since analytical standards may not be available for the target compounds. For instance, in flavor investigations it is not unusual to generate chromatograms containing several hundred compounds. It is impractical or impossible to obtain standards and determine response factors for each and every compound observed. Often, it suffices to obtain a semi-quantitative estimate of the concentration for each compound by simple peak area comparisons assuming a response factor equal to one. We use this method to estimate the levels of outgassing products from polymers in our polymer thermal desorption studies. Figure #4 is a GC-MS ion current and mass chromatogram derived from a typical DTD polymer desorption analysis using d-10 anthracene as an internal standard. In this experiment, approximately 500 mg of silicone rubber tubing was placed into a desorption tube, spiked with 0.5 ppm of d-10 anthracene and subjected to DTD analysis at 250 degrees C for 10 minutes. The lower trace is the integrated ion current profile, while the upper trace is a mass chromatogram for m/z 188 (molecular ion of d-10 anthracene). Semi-quantitative estimates for the levels of thermally desorbed products were obtained by simple peak area comparisons to that of the d-10 internal standard. Compounds identified included processing solvents, cross linking agents, plasticizers, antioxidants, polymerization accelerators and dimethylpolysiloxane oligomers. The DTD analysis employed was compared to solvent extraction methodology outlined by the FDA in the Code of Federal Regulations manual. The DTD analyses consistently yielded higher recoveries and less artifact formation than did the standard FDA methods. For instance, many of the acids observed in the DTD analyses were detected as ethyl esters in the FDA protocol, since the extraction regime used ethanol as solvent. Also, the ethanol failed to efficiently extract the polysiloxane oligomer components since they are very hydrophobic. Characterization by ethanol extraction alone would have missed these important potential migrants.
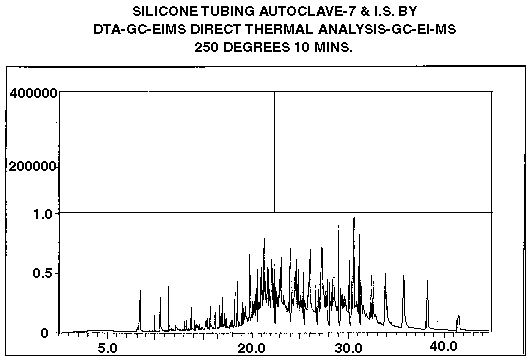
Figure 4 - GC-MS Ion Current and Mass Chromatogram For a Polymer Desorption Investigation Analyzed By DTD-GC-MS Using D-10 Anthracene Internal Standard. Upper Trace is Mass Chromatogram For Ion Mass 188, Which is the Molecular Ion of D-10 anthcene.
We have recently used internal standard methodology to quantify breath analysis data in human subjects ingesting raw and dehydrated garlic preparations (5). In this investigation, adsorbent traps were spiked with 100 ng of 2, 5-dimethylthiophene to serve as I.S. and subjects were required to exhale one liter of breath through the adsorbent traps at various time intervals after ingesting garlic. Preliminary qualitative breath analysis studies using GC-MS indicated several characteristic sulfur containing allylic compounds to be present on the breath. We then chose 2, 5-dimethylthiophene to serve as I.S. and constructed calibration curves for each specific analyte. This was accomplished by spiking the adsorbent traps with internal standard and various concentrations of target compounds. The traps were then analyzed by thermal desorption as usual and the calibration data was derived from peak area integrations. Figure #5 is a typical concentration curve obtained from diallylsulfide relative to 2, 5-dimethylthiophene I.S.. The curve is linear with a dynamic range covering four orders of magnitude and has a correlation coefficient of 1.0. The curve was constructed by plotting the mean values of five replicate determinations at five different concentrations. Excellent analytical precision was obtained. Typical ratios from the low, middle and high ends of the calibration were 0.059 +/- 0.003, 6.45 +/- 0.03 and 12.75 +/- 0.35 (n=5), respectively. Concentrations of garlic-borne phytochemicals on the breath of subjects were then calculated using the line equations from the calibration curves for each individual compound. The ideal gas law was used to convert the data into ppm v/v. Figure #6 shows the breath elimination curves from a subject after ingesting raw garlic. As was stated previously, this particular internal standard approach at quantification is considered to be accurate in terms of calculating the actual concentrations of various compounds on the Tenax adsorbent traps with no provision or correction for extraction efficiency or recovery. However, we could not conceive of any way to provide for matrix spiking of the breath. We are confident that the adsorbent traps were quantitative in the ability to trap the garlic-borne phytochemicals from the breath, since no odor was evident at the outlet of the traps.
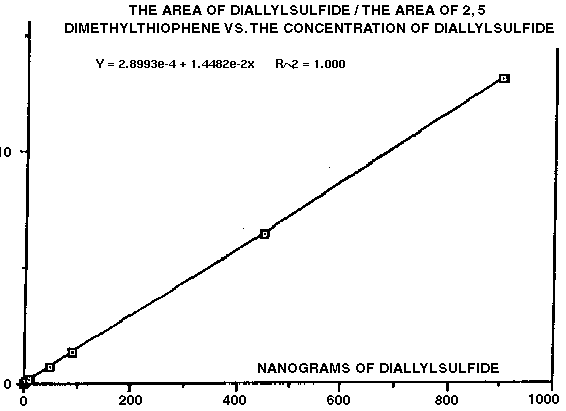
Figure 5 - Calibration Curve For Diallylsulfide Relative to 2,5-Dimethylthiophene Internal Standard. Data Was Produced By Spiking Adsorbent Traps Followed By Thermal Desorption GC-FID Analysis.
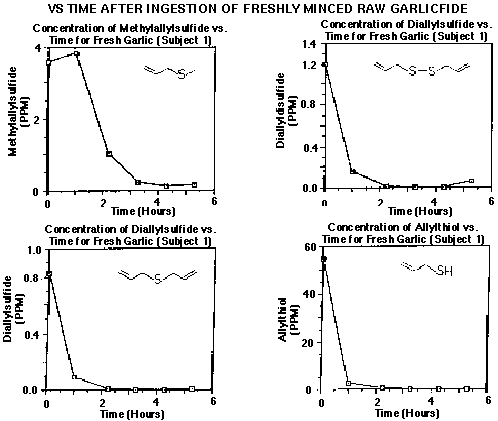
Figure 6 - Elimination Curves of Garlic-Borne Allylic Compounds On the Breath of Human Subjects Following Ingestion of Raw Garlic
STANDARD ADDITION METHOD OF QUANTIFICATION
The standard addition method of quantification is a useful means of quantifying P&T-TD analyses. In this technique, the matrix to be analyzed is split into approximately five portions and four of the sample aliquots are spiked with increasing levels (concentrations greater than those expected in the sample) of the target compounds. One portion of the sample is left unspiked. All samples are then subject to P&T-TD analysis. The goal is to form a linear detector response concentration curve for the four high level spiked samples. The linear curve is then extrapolated down to the low concentration level to obtain quantification of the target compounds in the unspiked sample which must be present at low levels for the principal to be valid. If the target compound concentration in the unspiked sample is sufficiently low relative to the spiked samples, then the error in the measurement will be low. However, if high levels of the analytes are already present in the matrix, the error in such extrapolations may be high and would require mathematical correction. In this case, an alternative would be to secure control matrices of the sample being tested which do not contain the target species and use these for spiking purposes. We routinely conduct off-odor/flavor investigations on food products which are tainted with solvents from floor finishing preparations, paints, pesticides and from numerous other sources. We have found that the best way to quantify such contamination levels is to actually spike the offending species (if available) into a control (not contaminated) product at various levels to develop a concentration curve. The suspect samples are then analyzed and the level of contamination is determined from this curve. In a cracker sample contaminated with mineral spirits from a warehouse painting operation, we observed a cluster of approximately 50 hydrocarbon peaks in its chromatogram when analyzed by P&T-TD. We simply summed the area integration of the contaminating species to obtain a total. Next, we spiked control crackers with 0.1, 1.0, 10.0 and 100.0 ppm of the mineral spirits then analyzed the spiked samples by P&T-TD using the exact same conditions as the suspect product. We then sum the area integrations for the mineral spirit peaks in each of the spiked samples and plot these values versus spike level in ppm to obtain a calibration curve. The level of contamination in the suspect product is then readily calculated from this curve. This methodology is very accurate since the extraction efficiency, recovery and detector response need not be quantitative to achieve useful data. The disadvantages are that many samples need to be analyzed and analytes or target compounds must be secured. Furthermore, for best results control matrices must be available for the spiking experiments.
SUMMARY
In summary, quantitative measurements by P&T-TD and DTD are best accomplished by first conducting qualitative measurements to optimize sample sizing, isolation, chromatographic and detection parameters. Next, a decision must be made regarding which technique of quantification is most suitable for the particular analysis. A quantitative analytical strategy is then devised and implemented. Methods development is performed to work out details such as spiking and recovery, building calibration curves, adjusting dynamic range and evaluating accuracy and precision. Finally, the methodology is challenged and validated using authentic or fortified samples.
ACKNOWLEDGMENT
We acknowledge the Center for Advanced Food Technology (CAFT) Mass Spectrometry Lab facility for providing instrumentation support for these projects. CAFT is an initiative of the New Jersey Commission of Science and Technology. We also thank Scientific Instrument Services, Inc. of Ringoes, New Jersey for donation of the Short Path Thermal Desorption instrument used in these studies. This is NJAES publication #D-10569-3-91.
REFERENCES
Hartman, T.G., Karmas, K., Chen, J., Shevade, A., Deagro, M. and Hwang, H. -I.; Determination of Vanillin, Other Phenolic Compounds and Flavors in Vanilla Beans by Direct Thermal Desorption - Gas Chromatography and Gas Chromatography - Mass Spectrometric Analysis, In ÒPhenolic Compounds in Food and HealthÓ, ACS Symposium Series, chapter 3, Eds. C.-T Ho and M. -T. Huang, In Press (1991).
Hartman, T.G., Lech, J. and Rosen, R.T.; Breath Analysis of Garlic-Borne Phytochemicals in Human Subjects by Combined Adsorbent Trapping, Short Path Thermal Desorption GC-MS, Proceedings of the 39th ASMS Conference on Mass Spectrometry and Allied Topics, pg. 641 (1991).
Manura, J.J.; Direct Thermal Analysis Using the Short Path Thermal Desorption System, Mass Spec Source, XIV, No. 2 (1991).
Manura, J.J., Overton, S.V., Baker, C.W. and Manos, J.N.; Design and Operation of the Short Path Thermal Desorption System, Mass Spec Source, XIII, No. 4 (1990).
Methods for the Determination of Organic Compounds in Drinking Water, Environmental Monitoring Systems Laboratory Office of Research and Development, US-EPA, Cincinnati, Ohio 45268 (1988).