- ▶
- Heaters/Source
- ▶
- Agilent Heaters and SensorsMass Spectrometry, Scientific Supplies & ManufacturingScientific Instrument Services 5973 Source Heater Tamper Resistant Allen Wrench 5973/5975 Quad Sensor 5985 Source Heater Assembly Agilent Interface Heater Assembly 5971 Interface Heater

- ▶
- Probes
- LiteratureApplication Notes Adsorbent Resins Guide Mass Spec Tips SDS Sheets FAQ MS Calibration Compound Spectra Manuals MS Links/Labs/ Organizations MS Online Tools Flyers on Products/Services Scientific Supplies Catalog About Us NextAdvance Bullet Blender® Homogenizer Protocols Micro-Mesh® Literature Instrumentation Literature Agilent GC/MS Literature SIS News / E-Mail Newsletter NIST MS Database - Update Notifications

- ▶
- Application NotesNote 103: EPA Method 325B, Novel Thermal Desorption Instrument Modification to Improve Sensitivity Note 102: Identification of Contaminants in Powdered Beverages by Direct Extraction Thermal Desorption GC/MS Note 101: Identification of Contaminants in Powdered Foods by Direct Extraction Thermal Desorption GC/MS Note 100: Volatile and Semi-Volatile Profile Comparison of Whole Versus Cracked Versus Dry Homogenized Barley Grains by Direct Thermal Extraction Note 99: Volatile and Semi-Volatile Profile Comparison of Whole vs. Dry Homogenized Wheat, Rye and Barley Grains by Direct Thermal Extraction GC/MS Note 98: Flavor and Aroma Profiles of Truffle Oils by Thermal Desorption GC/MS Note 97: Flavor Profiles of Imported and Domestic Beers by Purge & Trap Thermal Desorption GC/MS Note 96: Reducing Warping in Mass Spectrometer Filaments, with SISAlloy® Yttria/Rhenium Filaments Note 95: Detection of Explosives on Clothing Material by Direct and AirSampling Thermal Desorption GC/MS Note 94: Detection of Nepetalactone in the Nepeta Cataria Plant by Thermal Desorption GC/MS Note 93: Detection of Benzene in Carbonated Beverages with Purge & Trap Thermal Desorption GC/MS Note 92: Yttria Coated Mass Spectrometer Filaments Note 91: AutoProbe DEP Probe Tip Temperatures Note 90: An Automated MS Direct Probe for use in an Open Access Environment Note 89: Quantitation of Organics via a Mass Spectrometer Automated Direct Probe Note 88: Analysis of Silicone Contaminants on Electronic Components by Thermal Desorption GC-MS Note 87: Design and Development of an Automated Direct Probe for a Mass Spectrometer Note 86: Simulation of a Unique Cylindrical Quadrupole Mass Analyzer Using SIMION 7.0. Note 85: Replacing an Electron Multiplier in the Agilent (HP) 5973 MSD Note 84: Vacuum Pump Exhaust Filters - Charcoal Exhaust Traps Note 83: Vacuum Pump Exhaust Filters - Oil Mist Eliminators Note 82: Vacuum Pump Exhaust Filters Note 81: Rapid Bacterial Chemotaxonomy By DirectProbe/MSD Note 80: Design, Development and Testing of a Microprocessor ControlledAutomated Short Path Thermal Desorption Apparatus Note 79: Volatile Organic Compounds From Electron Beam Cured and Partially Electron Beam Cured Packaging Using Automated Short Path Thermal Desorption Note 78: A New Solution to Eliminate MS Down-Time With No-Tool-Changing of Analytical GC Columns Note 77: The Determination of Volatile Organic Compounds in VacuumSystem Components Note 76: Determination of the Sensitivity of a CRIMS System Note 75: An Apparatus for Sampling Volatile Organics From LivePlant Material Using Short Path Thermal Desorption Note 74: Examination of Source Design in Electrospray-TOF Using SIMION 3D Note 73: The Analysis of Perfumes and their Effect on Indoor Air Pollution Note 72: 1998 Version of the NIST/EPA/NIH Mass Spectral Library, NIST98 Note 71: Flavor Profile Determination of Rice Samples Using Shor tPath Thermal Desorption GC Methods Note 70: Application of SIMION 6.0 To a Study of the Finkelstein Ion Source: Part II Note 69: Application of SIMION 6.0 To a Study of the Finkelstein Ion Source: Part 1 Note 68: Use of a PC Plug-In UV-Vis Spectrometer To Monitor the Plasma Conditions In GC-CRIMS Note 67: Using Chemical Reaction Interface Mass Spectrometry (CRIMS) To Monitor Bacterial Transport In In Situ Bioremediation Note 66: Probe Tip Design For the Optimization of Direct Insertion Probe Performance Note 65: Determination of Ethylene by Adsorbent Trapping and Thermal Desorption - Gas Chromatography Note 64: Comparison of Various GC/MS Techniques For the Analysis of Black Pepper (Piper Nigrum) Note 63: Determination of Volatile and Semi-Volatile Organics in Printer Toners Using Thermal Desorption GC Techniques Note 62: Analysis of Polymer Samples Using a Direct Insertion Probe and EI Ionization Note 61: Analysis of Sugars Via a New DEP Probe Tip For Use With theDirect Probe On the HP5973 MSD Note 60: Programmable Temperature Ramping of Samples Analyzed ViaDirect Thermal Extraction GC/MS Note 59: Computer Modeling of a TOF Reflectron With Gridless Reflector Using SIMION 3D Note 58: Direct Probe Analysis and Identification of Multicomponent Pharmaceutical Samples via Electron Impact MS Note 57: Aroma Profiles of Lavandula species Note 56: Mass Spec Maintenance & Cleaning Utilizing Micro-Mesh® Abrasive Sheets Note 55: Seasonal Variation in Flower Volatiles Note 54: Identification of Volatile Organic Compounds in Office Products Note 53: SIMION 3D v6.0 Ion Optics Simulation Software Note 52: Computer Modeling of Ion Optics in Time-of-Flight mass Spectrometry Using SIMION 3D Note 51: Development and Characterization of a New Chemical Reaction Interface for the Detection of Nonradioisotopically Labeled Analytes Using Mass Spectrometry (CRIMS) Note 50: The Analysis of Multiple Component Drug Samples Using a Direct Probe Interfaced to the HP 5973 MSD Note 49: Analysis of Cocaine Utilizing a New Direct Insertion Probe on a Hewlett Packard 5973 MSD Note 48: Demonstration of Sensitivity Levels For the Detection of Caffeine Using a New Direct Probe and Inlet for the HP 5973 MSD Note 47: The Application Of SIMION 6.0 To Problems In Time-of-Flight Mass Spectrometry Note 46: Delayed Extraction and Laser Desorption: Time-lag Focusing and Beyond Note 45: Application of SIMION 6.0 to Filament Design for Mass Spectrometer Ionization Sources Note 44: The Design Of a New Direct Probe Inlet For a Mass Spectrometer Note 43: Volatile Organic Composition In Blueberries Note 42: The Influence of Pump Oil Purity on Roughing Pumps Note 41: Hydrocarbon Production in Pine by Direct Thermal Extraction Note 40: Comparison of Septa by Direct Thermal Extraction Note 39: Comparison of Sensitivity Of Headspace GC, Purge and Trap Thermal Desorption and Direct Thermal Extraction Techniques For Volatile Organics Note 38: A New Micro Cryo-Trap For Trapping Of Volatiles At the Front Of a GC Capillary Column Note 37: Volatile Organic Emissions from Automobile Tires Note 36: Identification Of Volatile Organic Compounds In a New Automobile Note 35: Volatile Organics Composition of Cranberries Note 34: Selection Of Thermal Desorption and Cryo-Trap Parameters In the Analysis Of Teas Note 33: Changes in Volatile Organic Composition in Milk Over Time Note 32: Selection and Use of Adsorbent Resins for Purge and Trap Thermal Desorption Applications Note 31: Volatile Organic Composition in Several Cultivars of Peaches Note 30: Comparison Of Cooking Oils By Direct Thermal Extraction and Purge and Trap GC/MS Note 29: Analysis Of Volatile Organics In Oil Base Paints By Automated Headspace Sampling and GC Cryo-Focusing Note 28: Analysis Of Volatile Organics In Latex Paints By Automated Headspace Sampling and GC Cryo-Focusing Note 27: Analysis of Volatile Organics In Soils By Automated Headspace GC Note 26: Volatile Organics Present in Recycled Air Aboard a Commercial Airliner Note 25: Flavor and Aroma in Natural Bee Honey Note 24: Selection of GC Guard Columns For Use With the GC Cryo-Trap Note 23: Frangrance Qualities in Colognes Note 22: Comparison Of Volatile Compounds In Latex Paints Note 21: Detection and Identification Of Volatile and Semi-Volatile Organics In Synthetic Polymers Used In Food and Pharmaceutical Packaging Note 20: Using Direct Thermal Desorption to Assess the Potential Pool of Styrene and 4-Phenylcyclohexene In Latex-Backed Carpets Note 19: A New Programmable Cryo-Cooling/Heating Trap for the Cryo-Focusing of Volatiles and Semi-Volatiles at the Head of GC Capillary Columns Note 18: Determination of Volatile Organic Compounds In Mushrooms Note 17: Identification of Volatile Organics in Wines Over Time Note 16: Analysis of Indoor Air and Sources of Indoor Air Contamination by Thermal Desorption Note 14: Identification of Volatiles and Semi-Volatiles In Carbonated Colas Note 13: Identification and Quantification of Semi-Volatiles In Soil Using Direct Thermal Desorption Note 12: Identification of the Volatile and Semi-Volatile Organics In Chewing Gums By Direct Thermal Desorption Note 11: Flavor/Fragrance Profiles of Instant and Ground Coffees By Short Path Thermal Desorption Note 10: Quantification of Naphthalene In a Contaminated Pharmaceutical Product By Short Path Thermal Desorption Note 9: Methodologies For the Quantification Of Purge and Trap Thermal Desorption and Direct Thermal Desorption Analyses Note 8: Detection of Volatile Organic Compounds In Liquids Utilizing the Short Path Thermal Desorption System Note 7: Chemical Residue Analysis of Pharmaceuticals Using The Short Path Thermal Desorption System Note 6: Direct Thermal Analysis of Plastic Food Wraps Using the Short Path Thermal Desorption System Note 5: Direct Thermal Analysis Using the Short Path Thermal Desorption System Note 4: Direct Analysis of Spices and Coffee Note 3: Indoor Air Pollution Note 2: Detection of Arson Accelerants Using Dynamic Headspace with Tenax® Cartridges Thermal Desorption and Cryofocusing Note 1: Determination of Off-Odors and Other Volatile Organics In Food Packaging Films By Direct Thermal Analysis-GC-MS Tech No. "A" Note 14: Elimination of "Memory" Peaks in Thermal Desorption Improving Sensitivity in the H.P. 5971 MSD and Other Mass Spectrometers - Part I of II Improving Sensitivity in the H.P. 5971 MSD and Other Mass Spectrometers- Part II of II Adsorbent Resins Guide Development and Field Tests of an Automated Pyrolysis Insert for Gas Chromatography. Hydrocarbon Production in Pine by Direct Thermal Extraction A New Micro Cryo-Trap for the Trapping of Volatiles at the Front of a GC Capillary (019P) - Comparison of Septa by Direct Thermal Extraction Volatile Organic Composition in Blueberry Identification of Volatile Organic Compounds in Office Products Detection and Indentification of Volatiles in Oil Base Paintsby Headspace GC with On Column Cryo-Trapping Evaluation of Septa Using a Direct Thermal Extraction Technique INFLUENCE OF STORAGE ON BLUEBERRY VOLATILES Selection of Thermal Desorption and Cryo-Trap Parameters in the Analysis of Teas Redesign and Performance of a Diffusion Based Solvent Removal Interface for LC/MS The Design of a New Direct Probe Inlet for a Mass Spectrometer Analytes Using Mass Spectrometry (CRIMS) Application of SIMION 6.0 to Filament Design for Mass Spectrometer Ionization Sources A Student Guide for SIMION Modeling Software Application of SIMION 6.0 to Problems in Time-of-flight Mass Spectrometry Comparison of Sensitivity of Headspace GC, Purge and TrapThermal Desorption and Direct Thermal Extraction Techniques forVolatile Organics The Influence of Pump Oil Purity on Roughing Pumps Analysis of Motor Oils Using Thermal Desorption-Gas Chromatography-Mass Spectrometry IDENTIFICATION OF VOLATILE ORGANIC COMPOUNDS IN PAPER PRODUCTS Computer Modeling of Ion Optics in Time-of-Flight mass Spectrometry using SIMION 3D Seasonal Variation in Flower Volatiles Development of and Automated Microprocessor Controlled Gas chromatograph Fraction Collector / Olfactometer Delayed Extraction and Laser Desorption: Time-lag Focusing and Beyond A New Micro Cryo-Trap for the Trapping of Volatiles at the Front of a GC Column Design of a Microprocessor Controlled Short Path Thermal Desorption Autosampler Computer Modeling of Ion Optics in Time-of-Flight Mass Spectrometry Using SIMION 3D Thermal Desorption Instrumentation for Characterization of Odors and Flavors
- ▶
- Note 81: Rapid Bacterial Chemotaxonomy By DirectProbe/MSD (This Page)

*Scientific Instrument Services, Ringoes, NJ
1National Center for Cancer and Toxicological Research, Jefferson, AR 72079, Ph: (501) 543-7108 Fax: (501) 543-7686
Presented at PittCon 99, Orlando, FL, March 1999
Abstract
Recent developments using mass spectrometry for rapid bacterial chemotaxonomy show great promise for the application of these techniques to microbiological screening procedures in both routine and emergent situations1,2. One obstacle to the broader application of mass spectrometry to bacterial identification is the high cost of the research-grade instrumentation used in most of the work done to date. Here, a slightly modified HP 5973 Mass Selective Detector is used to assess 25 different strains of bacteria. The simplicity of direct-probe introduction makes this method attractive as a high-throughput screening technique. Samples are introduced via the direct exposure probe, and the ionization mode is 70 eV EI. Modification of the MSD includes adding the capability of elevating the source temperature to 350C, and the use of a filament designed for high temperature. Significant improvement in sensitivity at higher mass is the main benefit of these modifications. Gold-plated probe tips are used in the analysis to improve heat transfer and avoid catalysis. Collected data are analyzed with pattern-recognition software and are subjected to Canonical Variate analysis of components used for identification. Results show that direct probe/EI mass spectrometry with a low cost benchtop instrument can provide high quality spectra for use in bacterial identification.
Introduction
The concept of Pyrolysis Mass Spectrometry (Py-MS) as a tool for taxonomic identification of whole bacterial cells based on distinct chemical constituents is not new.3 Recent studies have outlined techniques and methods for rapid, reproducible identification of bacteria using Py-MS with different ionization techniques and data handling procedures1,2,4. A common factor in previous work, as well as a major obstacle to wider implementation of the technique, has been the use of expensive, research-grade mass spectrometers. These instruments were needed for the high-quality spectra they yield which are rich in information in the higher (300 - 700 amu) mass range. With few exceptions, smaller benchtop instruments have not been able to produce adequate spectra due to resolution and sensitivity issues related to many of the same design considerations that kept their size and cost down. Improvements are continuously being made; however, and newer benchtop mass spectrometers are providing performance that meets or exceeds that of their research-grade counterparts of a few years ago. The purpose of these experiments is to implement Py-MS of whole bacterial cells on an inexpensive benchtop instrument and to show that excellent spectra can be obtained, which are suitable for correlation analysis and therefore applicable to previously described identification methods.
Materials and Methods
25 strains of bacteria (see Table 1) were cultured as described previously2 and pure colonies of each strain were selected and suspended in 75% ethanol until moderate turbidity was obtained. Sample suspensions were refrigerated when not in use, and were analyzed within 10 days of collection. Samples were sonicated for 1 minute prior to analysis to resuspend the cells.
The mass spectrometer used was a Hewlett-Packard (Palo Alto CA) model 5973 Mass Selective Detector. A modified repeller/source heater assembly as well as two high-temperature filament assemblies (SIS Inc., Ringoes NJ) were installed. These modifications, along with a minor adjustment to the MS ChemStation software, allow the operation of the MSD with ion source temperatures of up to 500ºC. The source was held at 350ºC for these experiments. The instrument set to scan from 50 amu to 750 amu at 2.14 scans per second. Ionization energy was 70 eV.
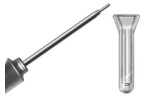
An SIS Direct Insertion Probe with ProbeDirectTM control software (SIS Inc.) was used for sample introduction and pyrolysis control. Copper tips plated with gold were used in place of the standard glass vials to enhance heat transfer to the sample and minimize catalytic degradation. One microliter of the sample suspension was placed on the probe tip for analysis. Each sample was allowed to dry before insertion into the interface, and remained in the interface for exactly 30 seconds while residual solvent vapor was removed. The probe temperature program was started at the moment when the probe tip contacted the ion source. For each sample, the probe was programmed to heat ballistically from an initial temperature of 50ºC to 350ºC. The average heating rate was approximately 1100 ºC/minute. The probe remained at maximum temperature for 5 minutes, and was then cooled for removal. All samples were analyzed at least twice, and some were replicated as many as four times. One of the 25 strains analyzed was not subjected to correlation analysis, because it yielded such radically different chromatograms that the spectra could not be averaged in the same way as the other samples. The discrepancy may be related to the condition of the probe tip. All replicates of the remaining samples were included in the correlation analysis.
Data were collected with MS ChemStation software
(Hewlett-Packard, Palo Alto CA). A post-run macro served to perform consistent
averaging of spectra, and save the resulting spectrum as an ASCII file.
All spectra from 1.0 minutes to 3.0 minutes were averaged for each run.
The selection of this time frame was based on comparison of replicate total
ion chromatograms (See Figure 1). After an initial set of experiments using
the entire range, data in the 200 - 650 amu range were selected for analysis.
A custom program was written to convert the HP formatted file to one that
can be read by the RESolve pattern recognition software (Colorado School
of Mines, Boulder CO).
| Table 1 | |
| Bacterial strain | Group |
| Aeromonas hydrophila | C |
| Aeromonas macrophila | W |
| Bacillus licheniformis | I |
| Bacillus subtilis | Y |
| Bacillus thuringiensis | H |
| Clavibacter michiganense | N |
| E. coli 1090 | A |
| Enterobacter cloacae | B |
| Hot Springs Bacillus | O |
| Klebsiella oxytoca | F |
| Klebsiella pneumoniae | G |
| Proteus mirabilis | S |
| Pseudomonas aeruginosa | b |
| Pseudomonas mendocina | c |
| Pseudomonas putida | a |
| Rathayibacter tritici | L |
| Salmonella typhimurium | X |
| Shigella flexneri | V |
| Staph. aureus | Z |
| Staph. auricularus | E |
| Staph. epidermidis | O |
| Staph. hominis | K |
| Staph. warneri | J |
| Staph.aureus mutant | D |
| Strep. equinus | T |
Results and Discussion
Results of the pattern matching showed excellent agreement with earlier studies. An 89% cross validation was achieved, indicating that the program correctly matched the same samples with a high degree of precision. The samples that were incorrectly identified came from only three of the 25 classes. These samples were noted as having been run in extra replicates due to operator error or obvious irregularity in the observed chromatogram. Several interesting and unexpected results came from the analysis of this data set. The data were originally analyzed using a wider average spectrum from a larger time range. This was an attempt to use a simple method of extracting important information from all the samples without scrutinizing each one closely; an important aspect of any system developed to rapidly identify unknown strains of bacteria. Instead of merely assuring that meaningful information was included from each sample, this practice also introduced more random noise and resulted in a less accurate analysis (82% cross validation). This is highlighted by the fact that in the first analysis, 12 Principal Components (PC's) were calculated and accounted for only 97% of the total variation in the sample, whereas in the more narrowly selected data, only 5 PC's were needed to encompass 99% of the variation. The range for the second analysis was selected by overlaying the Total Ion Chromatograms from the replicate samples and selecting a region where ion abundance was similar. Additionally, a smaller range of ions was used in the average spectrum, facilitating the data file format conversion, and circumventing a limitation of the pattern-matching software that restricts the number of ions in a sample spectrum to 500 or less. In the original analysis, this number was achieved by eliminating from the spectrum a combination of ions with the largest and smallest abundance. It is suspected that valuable information can be lost by treating the data in this manner.
Figure 1. Three Total Ion Chromatograms of the Same Bacteria (E.coli 1090, Group A). Area used for averaging for the first analysis is indicated in green (the region highlighted in pink was subtracted as background). The second analysis used the average of spectra from the yellow region without background subtraction.
A noteworthy aspect of the first correlation analysis is that although the centour score is not 100% for every sample, failure to properly identify a sample as coming from a particular group occurred in a very predictable and manageable way. When the program mis-identified a sample, there were two possible configurations: all the values were reported as 0.000% and it just chose the wrong one from among bad lots, or two values were 100% and the program chose the wrong one, but the other one was the correct answer. These results indicate that faced with a true unknown, one could recognize whether the program was correct by comparing these probabilities. If a sample was identified as "X" and the probability was 0.000, one could either conclude that it wasn't "X", or one could make up a comparison set using several authentic replicates of "X" and several of the unknown and decide whether they were the same or not. If it was identified as "X" and there was a 100% probability that it could be "X" or "Y", it would be possible to set up a similar direct comparison between the unknown and authentic spectra of the two possibilities and reach a conclusion. With a carefully prepared spectral library all these experiments could be handled in software without further PyMS analyses.
Figure 2. Representative Averaged Spectra From Two Different Strains
Another striking aspect of the data is the high quality of the spectra in general, and particularly the preservation of high mass ions. Additionally, these spectra were obtained using one half to one third of the amount of sample used in our previous work. Ions are present well into the 600 - 700 amu range. The presence of these ions and the high sensitivity are attributable to the high temperature at which the ion source was operated. At higher temperatures, any material entering the ion source is less likely to condense on metal surfaces. It is, therefore, more likely to be ionized, and the result is a greater rate of transmission of material out of the source and into the analyzer. A cleaner source is also more stable, and provides better run-to-run and day-to-day reproducibility.
Figure 3. Results of the pattern recognition analysis including plots of the two canonical variates were used.
It should be noted that a significant source of variability in these analyses lies with the operator. While elaborate mechanisms have been developed to evenly coat pyrolysis wires and probe filaments with bacterial suspensions in order to achieve more reproducible spectra, here no more effort was expended in the preparation of the samples than assuring that most of the 1 ml sample was deposited on the tip of the probe.
Figure 4. 500 - 650 amu range From Figure 2a magnified
Conclusions
We have demonstrated the ability of an inexpensive, benchtop mass spectrometer to generate high quality data that can be used in the identification of bacteria by pattern recognition based on Py-MS. The modifications made to the instrument were minor, and resulted in excellent sensitivity and high-mass transmission. It is possible to improve the performance of the pattern recognition analysis by selecting appropriate areas of the TIC from which to draw the spectra used, as well as restricting the spectra to those peaks which contain significant information. The processes by which these selections are made can be automated. High quality spectra combined with automated data processing and affordable instrumentation will result in greatly expanding the base of potential users of this technique. Observations incidental to our analyses indicate that if good libraries are available, accurate identification can even be made from lower quality spectra without the need to re-run samples.
Acknowledgements
The authors wish to thank Pat Perkins at Hewlett-Packard for help with the high-temperature ion source conversion, and Manuel Holcomb at NCTR for culturing the bacteria and preparing the suspensions.
References
1.Wilkes J. G., Sutherland J., Rafii F., Voorhees K. J., Warden C., Hall R., Freeman J. P., and Lay J. O. Factors Which Affect The Reproducibility Of Pyrolysis Mass Spectra For Biological Samples. Poster presentation ASMS 1996.
2. Wilkes J.G., Holcomb M., Rafii F., Letarte S., Bertrand M.J., and Colby S. Probe Introduction/Mab/Ms For Rapid Bacterial Chemotaxonomy. Poster presentation ASMS 1998.
3. Gutteridge C.S., Norris, J.R. Journal of Applied Bacteriology 1979, 47, 5-43.
4. Barshick, S.A., Wolf, D.A., and Vass, A.A. Analytical Chemistry 1999, 71, 633-641.