- ▶
- Heaters/Source
- ▶
- Agilent Heaters and SensorsMass Spectrometry, Scientific Supplies & ManufacturingScientific Instrument Services 5973 Source Heater Tamper Resistant Allen Wrench 5973/5975 Quad Sensor 5985 Source Heater Assembly Agilent Interface Heater Assembly 5971 Interface Heater
- ▶
- Reference Material on InstrumentationArticle - A High Temperature Direct Probe for a Mass Spectrometer Design of a Direct Exposure Probe and Controller for use ona Hewlett-Packard 5989 Mass Spectrometer SIS AP1000 AutoProbe™ SIS AP2000 AutoProbe™ - Description of System HPP7: Direct Probe Electronics Console HPP7: Direct Probe for the Agilent (HP) 5973/5975 MSD HPP7: HP Direct Probe Application Notes HPP7: Installation Directions for the Direct Probe HPP7: Side Cover for the HP 5973 MSD HPP7: Support HPP7: Probe Inlet System for the Agilent (HP) 5973 and 5975 MSD with Automatic Indexed Stops HPP7: Theory of Operation of the Direct Probe and Probe Inlet System Direct Thermal Extraction Thermal Desorption Application Notes Environmental Thermal Desorption Application Notes Food Science Thermal Desorption Application Notes Forensic Thermal Desorption Application Notes GC Cryo-Trap Application Notes Headspace Application Notes Purge & Trap Thermal Desorption Application Notes Theory of Operation of the AutoDesorb® System AutoDesorb Notes for SIS Dealers Adsorbent Resin Application Notes Installation of the Short Path Thermal Desorption System on Agilent (HP) and Other GCs Installation of the Short Path Thermal Desorption System on a Varian 3400 GC AutoDesorb® System Development Team Thermal Desorption Applications and Reference Materials Installation of the Short Path Thermal Desorption System - TD5 Part I - Design & Operation of the Short Path ThermalDesorption System Installation Instructions for the Model 951 GC Cryo-Trap on the HP 5890 Series GC Installation Instructions for the Model 961 GC Cryo-Trap on the HP 5890 Series GC Operation of the Model 951/961 GC Cryo-Trap SIS GC Cryo Traps - Theory of Operation NIST/EPA/NIH Mass Spectral Enhancements - 1998 version (NIST98) SIMION 3D Ion Optics Class Mass Spectrometer Source Cleaning Methods MS Tip: Mass Spectrometer Source Cleaning Procedures Mass Spec Source Cleaning Procedures Micro-Mesh® Abrasive Sheets Research Papers Using New Era Syringe Pump Systems EI Positive Ion Spectra for Perfluorokerosene (PFK) Cap Liner Information How do I convert between fluid oz and milliliters? Which bottle material should I choose? Which bottle mouth should I choose? The Bottle Selection Guide CGA Connections for Gas Tanks Chemical Reaction Interface Mass Spectrometry (CRIMS)

- LiteratureApplication Notes Adsorbent Resins Guide Mass Spec Tips SDS Sheets FAQ MS Calibration Compound Spectra Manuals MS Links/Labs/ Organizations MS Online Tools Flyers on Products/Services Scientific Supplies Catalog About Us NextAdvance Bullet Blender® Homogenizer Protocols Micro-Mesh® Literature Instrumentation Literature Agilent GC/MS Literature SIS News / E-Mail Newsletter NIST MS Database - Update Notifications

- ▶
- Chemical Reaction Interface Mass Spectrometry (CRIMS)51. Development and Characterization of a New Chemical Interface for the Detection of Nonradioisotopically Labeled Analytes Using Mass Spectrometry (CRIMS) (EAS 96) 67. Using Chemical Reaction Interface (CRIMS) to Monitor Bacteria Transport in Situ (PittCon 98) 68. Using a Plug In UV-Vis Spectrometer to Monitor the Plasma Conditions in a GC CRIMS (EAS 98) 76. Determination of the Sensitivity of a CRIMS System (ASMS 98)

- Application NotesNote 103: EPA Method 325B, Novel Thermal Desorption Instrument Modification to Improve Sensitivity Note 102: Identification of Contaminants in Powdered Beverages by Direct Extraction Thermal Desorption GC/MS Note 101: Identification of Contaminants in Powdered Foods by Direct Extraction Thermal Desorption GC/MS Note 100: Volatile and Semi-Volatile Profile Comparison of Whole Versus Cracked Versus Dry Homogenized Barley Grains by Direct Thermal Extraction Note 99: Volatile and Semi-Volatile Profile Comparison of Whole vs. Dry Homogenized Wheat, Rye and Barley Grains by Direct Thermal Extraction GC/MS Note 98: Flavor and Aroma Profiles of Truffle Oils by Thermal Desorption GC/MS Note 97: Flavor Profiles of Imported and Domestic Beers by Purge & Trap Thermal Desorption GC/MS Note 96: Reducing Warping in Mass Spectrometer Filaments, with SISAlloy® Yttria/Rhenium Filaments Note 95: Detection of Explosives on Clothing Material by Direct and AirSampling Thermal Desorption GC/MS Note 94: Detection of Nepetalactone in the Nepeta Cataria Plant by Thermal Desorption GC/MS Note 93: Detection of Benzene in Carbonated Beverages with Purge & Trap Thermal Desorption GC/MS Note 92: Yttria Coated Mass Spectrometer Filaments Note 91: AutoProbe DEP Probe Tip Temperatures Note 90: An Automated MS Direct Probe for use in an Open Access Environment Note 89: Quantitation of Organics via a Mass Spectrometer Automated Direct Probe Note 88: Analysis of Silicone Contaminants on Electronic Components by Thermal Desorption GC-MS Note 87: Design and Development of an Automated Direct Probe for a Mass Spectrometer Note 86: Simulation of a Unique Cylindrical Quadrupole Mass Analyzer Using SIMION 7.0. Note 85: Replacing an Electron Multiplier in the Agilent (HP) 5973 MSD Note 84: Vacuum Pump Exhaust Filters - Charcoal Exhaust Traps Note 83: Vacuum Pump Exhaust Filters - Oil Mist Eliminators Note 82: Vacuum Pump Exhaust Filters Note 81: Rapid Bacterial Chemotaxonomy By DirectProbe/MSD Note 80: Design, Development and Testing of a Microprocessor ControlledAutomated Short Path Thermal Desorption Apparatus Note 79: Volatile Organic Compounds From Electron Beam Cured and Partially Electron Beam Cured Packaging Using Automated Short Path Thermal Desorption Note 78: A New Solution to Eliminate MS Down-Time With No-Tool-Changing of Analytical GC Columns Note 77: The Determination of Volatile Organic Compounds in VacuumSystem Components Note 76: Determination of the Sensitivity of a CRIMS System Note 75: An Apparatus for Sampling Volatile Organics From LivePlant Material Using Short Path Thermal Desorption Note 74: Examination of Source Design in Electrospray-TOF Using SIMION 3D Note 73: The Analysis of Perfumes and their Effect on Indoor Air Pollution Note 72: 1998 Version of the NIST/EPA/NIH Mass Spectral Library, NIST98 Note 71: Flavor Profile Determination of Rice Samples Using Shor tPath Thermal Desorption GC Methods Note 70: Application of SIMION 6.0 To a Study of the Finkelstein Ion Source: Part II Note 69: Application of SIMION 6.0 To a Study of the Finkelstein Ion Source: Part 1 Note 68: Use of a PC Plug-In UV-Vis Spectrometer To Monitor the Plasma Conditions In GC-CRIMS Note 67: Using Chemical Reaction Interface Mass Spectrometry (CRIMS) To Monitor Bacterial Transport In In Situ Bioremediation Note 66: Probe Tip Design For the Optimization of Direct Insertion Probe Performance Note 65: Determination of Ethylene by Adsorbent Trapping and Thermal Desorption - Gas Chromatography Note 64: Comparison of Various GC/MS Techniques For the Analysis of Black Pepper (Piper Nigrum) Note 63: Determination of Volatile and Semi-Volatile Organics in Printer Toners Using Thermal Desorption GC Techniques Note 62: Analysis of Polymer Samples Using a Direct Insertion Probe and EI Ionization Note 61: Analysis of Sugars Via a New DEP Probe Tip For Use With theDirect Probe On the HP5973 MSD Note 60: Programmable Temperature Ramping of Samples Analyzed ViaDirect Thermal Extraction GC/MS Note 59: Computer Modeling of a TOF Reflectron With Gridless Reflector Using SIMION 3D Note 58: Direct Probe Analysis and Identification of Multicomponent Pharmaceutical Samples via Electron Impact MS Note 57: Aroma Profiles of Lavandula species Note 56: Mass Spec Maintenance & Cleaning Utilizing Micro-Mesh® Abrasive Sheets Note 55: Seasonal Variation in Flower Volatiles Note 54: Identification of Volatile Organic Compounds in Office Products Note 53: SIMION 3D v6.0 Ion Optics Simulation Software Note 52: Computer Modeling of Ion Optics in Time-of-Flight mass Spectrometry Using SIMION 3D Note 51: Development and Characterization of a New Chemical Reaction Interface for the Detection of Nonradioisotopically Labeled Analytes Using Mass Spectrometry (CRIMS) Note 50: The Analysis of Multiple Component Drug Samples Using a Direct Probe Interfaced to the HP 5973 MSD Note 49: Analysis of Cocaine Utilizing a New Direct Insertion Probe on a Hewlett Packard 5973 MSD Note 48: Demonstration of Sensitivity Levels For the Detection of Caffeine Using a New Direct Probe and Inlet for the HP 5973 MSD Note 47: The Application Of SIMION 6.0 To Problems In Time-of-Flight Mass Spectrometry Note 46: Delayed Extraction and Laser Desorption: Time-lag Focusing and Beyond Note 45: Application of SIMION 6.0 to Filament Design for Mass Spectrometer Ionization Sources Note 44: The Design Of a New Direct Probe Inlet For a Mass Spectrometer Note 43: Volatile Organic Composition In Blueberries Note 42: The Influence of Pump Oil Purity on Roughing Pumps Note 41: Hydrocarbon Production in Pine by Direct Thermal Extraction Note 40: Comparison of Septa by Direct Thermal Extraction Note 39: Comparison of Sensitivity Of Headspace GC, Purge and Trap Thermal Desorption and Direct Thermal Extraction Techniques For Volatile Organics Note 38: A New Micro Cryo-Trap For Trapping Of Volatiles At the Front Of a GC Capillary Column Note 37: Volatile Organic Emissions from Automobile Tires Note 36: Identification Of Volatile Organic Compounds In a New Automobile Note 35: Volatile Organics Composition of Cranberries Note 34: Selection Of Thermal Desorption and Cryo-Trap Parameters In the Analysis Of Teas Note 33: Changes in Volatile Organic Composition in Milk Over Time Note 32: Selection and Use of Adsorbent Resins for Purge and Trap Thermal Desorption Applications Note 31: Volatile Organic Composition in Several Cultivars of Peaches Note 30: Comparison Of Cooking Oils By Direct Thermal Extraction and Purge and Trap GC/MS Note 29: Analysis Of Volatile Organics In Oil Base Paints By Automated Headspace Sampling and GC Cryo-Focusing Note 28: Analysis Of Volatile Organics In Latex Paints By Automated Headspace Sampling and GC Cryo-Focusing Note 27: Analysis of Volatile Organics In Soils By Automated Headspace GC Note 26: Volatile Organics Present in Recycled Air Aboard a Commercial Airliner Note 25: Flavor and Aroma in Natural Bee Honey Note 24: Selection of GC Guard Columns For Use With the GC Cryo-Trap Note 23: Frangrance Qualities in Colognes Note 22: Comparison Of Volatile Compounds In Latex Paints Note 21: Detection and Identification Of Volatile and Semi-Volatile Organics In Synthetic Polymers Used In Food and Pharmaceutical Packaging Note 20: Using Direct Thermal Desorption to Assess the Potential Pool of Styrene and 4-Phenylcyclohexene In Latex-Backed Carpets Note 19: A New Programmable Cryo-Cooling/Heating Trap for the Cryo-Focusing of Volatiles and Semi-Volatiles at the Head of GC Capillary Columns Note 18: Determination of Volatile Organic Compounds In Mushrooms Note 17: Identification of Volatile Organics in Wines Over Time Note 16: Analysis of Indoor Air and Sources of Indoor Air Contamination by Thermal Desorption Note 14: Identification of Volatiles and Semi-Volatiles In Carbonated Colas Note 13: Identification and Quantification of Semi-Volatiles In Soil Using Direct Thermal Desorption Note 12: Identification of the Volatile and Semi-Volatile Organics In Chewing Gums By Direct Thermal Desorption Note 11: Flavor/Fragrance Profiles of Instant and Ground Coffees By Short Path Thermal Desorption Note 10: Quantification of Naphthalene In a Contaminated Pharmaceutical Product By Short Path Thermal Desorption Note 9: Methodologies For the Quantification Of Purge and Trap Thermal Desorption and Direct Thermal Desorption Analyses Note 8: Detection of Volatile Organic Compounds In Liquids Utilizing the Short Path Thermal Desorption System Note 7: Chemical Residue Analysis of Pharmaceuticals Using The Short Path Thermal Desorption System Note 6: Direct Thermal Analysis of Plastic Food Wraps Using the Short Path Thermal Desorption System Note 5: Direct Thermal Analysis Using the Short Path Thermal Desorption System Note 4: Direct Analysis of Spices and Coffee Note 3: Indoor Air Pollution Note 2: Detection of Arson Accelerants Using Dynamic Headspace with Tenax® Cartridges Thermal Desorption and Cryofocusing Note 1: Determination of Off-Odors and Other Volatile Organics In Food Packaging Films By Direct Thermal Analysis-GC-MS Tech No. "A" Note 14: Elimination of "Memory" Peaks in Thermal Desorption Improving Sensitivity in the H.P. 5971 MSD and Other Mass Spectrometers - Part I of II Improving Sensitivity in the H.P. 5971 MSD and Other Mass Spectrometers- Part II of II Adsorbent Resins Guide Development and Field Tests of an Automated Pyrolysis Insert for Gas Chromatography. Hydrocarbon Production in Pine by Direct Thermal Extraction A New Micro Cryo-Trap for the Trapping of Volatiles at the Front of a GC Capillary (019P) - Comparison of Septa by Direct Thermal Extraction Volatile Organic Composition in Blueberry Identification of Volatile Organic Compounds in Office Products Detection and Indentification of Volatiles in Oil Base Paintsby Headspace GC with On Column Cryo-Trapping Evaluation of Septa Using a Direct Thermal Extraction Technique INFLUENCE OF STORAGE ON BLUEBERRY VOLATILES Selection of Thermal Desorption and Cryo-Trap Parameters in the Analysis of Teas Redesign and Performance of a Diffusion Based Solvent Removal Interface for LC/MS The Design of a New Direct Probe Inlet for a Mass Spectrometer Analytes Using Mass Spectrometry (CRIMS) Application of SIMION 6.0 to Filament Design for Mass Spectrometer Ionization Sources A Student Guide for SIMION Modeling Software Application of SIMION 6.0 to Problems in Time-of-flight Mass Spectrometry Comparison of Sensitivity of Headspace GC, Purge and TrapThermal Desorption and Direct Thermal Extraction Techniques forVolatile Organics The Influence of Pump Oil Purity on Roughing Pumps Analysis of Motor Oils Using Thermal Desorption-Gas Chromatography-Mass Spectrometry IDENTIFICATION OF VOLATILE ORGANIC COMPOUNDS IN PAPER PRODUCTS Computer Modeling of Ion Optics in Time-of-Flight mass Spectrometry using SIMION 3D Seasonal Variation in Flower Volatiles Development of and Automated Microprocessor Controlled Gas chromatograph Fraction Collector / Olfactometer Delayed Extraction and Laser Desorption: Time-lag Focusing and Beyond A New Micro Cryo-Trap for the Trapping of Volatiles at the Front of a GC Column Design of a Microprocessor Controlled Short Path Thermal Desorption Autosampler Computer Modeling of Ion Optics in Time-of-Flight Mass Spectrometry Using SIMION 3D Thermal Desorption Instrumentation for Characterization of Odors and Flavors

- ▶
- 76. Determination of the Sensitivity of a CRIMS System (ASMS 98) (This Page)
Presented at ASMS, Orlando, FL., June 1998
INTRODUCTION
Chemical Reaction Interface Mass Spectrometry (CRIMS) is a technique that exploits stable isotope enrichment for enhanced detection of analytes and their by-products. The sensitivity of a CRIMS system depends on its ability to detect low levels of material as well as to distinguish isotopic enrichment from natural isotopic abundance. Many uses for the CRIMS technique have been proposed ranging from drug metabolism analysis to facilitating pollution remediation.1,4
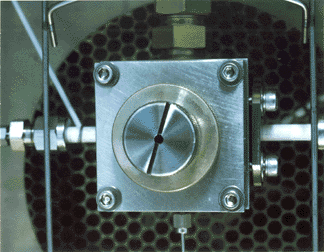
CRIMS Cavity Inside GC Oven
CRIMS enhances isotope detection by assuring that an overwhelming majority of the element in question (Carbon, for instance) is in the form of one small inorganic species. This is accomplished by combusting the effluent from a chromatographic separation in a plasma, then reacting the resulting atomic species with a strong (usually oxidizing) reagent. In the case of organic compounds reacted with SO2, most of the carbon will be in the form of CO2. 12CO2 is represented by ions of m/z 44 and 13CO2 by m/z 45. Enrichment is detected by deriving an "enrichment chromatogram" from the total ion chromatogram, or by integrating selected ion chromatograms separately and then comparing the relative abundance of mass 45 to mass 44 for a given peak. Enrichment chromatograms are generated by mass calculation software that performs mathematical operations on the signals from each isotope channel. For instance, multiplying the abundance of 12CO2 (m/z 44) by the amount of 13CO2 occurring in nature yields the theoretical natural abundance of the heavy isotope for each data point in the chromatogram. Subtracting this result from the actual m/z 45 signal gives a chromatogram in which peaks are present only when the ratio of 13C to 12C rises above the natural abundance value used in the calculation. Enrichment levels based on careful integration of the individual ion chromatograms yields more reproducible results than integration of the enrichment-only chromatogram and should be used when making critical measurements. More information about the chemistry and application of CRIMS can be found in the literature.1,2
The issue of sensitivity in a CRIMS system is related to the ability to distinguish between naturally occurring levels of heavy isotopes and enriched or elevated amounts. Due to the random nature of the noise in a blank baseline, examining the isotope ratios in the baseline itself has little meaning. The blank baseline contains sources of noise that are independent of any discreet compound and affect all masses equally; electronic background from the detector is one example. The influence of these mass-independent signals is dominant when only a small amount of analyte is present, and small isotopic ratios are buried. Only when there is a sufficient amount of material in the ion source (e.g. a peak) can the correct ratio be expected. For this reason, experiments concerned with determination of exact or very small degrees of enrichment should be carried out using substantial amounts of material.3 Figure 1 illustrates the change in isotope ratio as a peak elutes. Nominal or "baseline" isotope ratios can be determined by repeated analysis of unenriched material, and sensitivity is related to the variation in the nominal value. Generally, if a peak produces an enrichment signal elevation in excess of three standard deviations of the mean nominal value, it can be integrated and this value is considered the limit of detection for enrichment.
In terms of absolute sensitivity to small amounts of material, the methods for CRIMS do not differ from those used in normal chromatography, and simply involve determining where the signal-to-noise ratio is unacceptable or where linearity of response falls off. Such methods would most likely be used when CRIMS is employed as an element-specific detector.1,2
Experimental
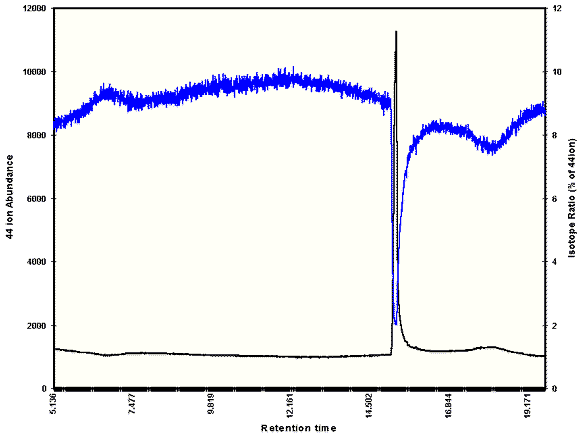
Figure 1. Effect of Eluting Peak On isotopic Ratios. Isotope Ratios (blue) Drop to Appropriate Levels as CO2 (black) enters detector
In the examples that follow, the enrichment detection limit for 13C enriched caffeine was examined using a GC-CRIMS system (SIS Inc.) based on a Hewlett-Packard 5890 Series II GC and a 5971 Mass Selective Detector modified after Song et.al 2 and using SO2 as the reagent gas. Hewlett-Packard G1034C ChemStation software was used for data aquisition and analysis, and enrichment-only chromatograms were generated by ProCalc (ProLab Resources, Inc.).
Seven 1 ml samples of unenriched Caffeine were injected at various concentrations ranging from 226 ng/ml to 565 ng/ml. Variation in the isotope ratios was found to be independent of sample concentration, and the results of the sample were averaged to give the nominal natural abundance. The enrichment-only chromatograms (EOCs) are rarely completely flat, owing to slight variation in the isotopic ratio of the material used, minor chromatographic effects and baseline drift. For unenriched material, the "signal" generated in the EOCs should fall within three standard deviations from the mean baseline value calculated close to the peak. EOCs were evaluated by taking boxcar sums of 9 data points (representing the approximate width of the baseline disturbances) in the vicinity of the caffeine peak. The greatest of these was compared to the sum of 9 other points taken in a clear area of the chromatogram approximately one minute before the peak. The difference is the baseline signal due to unenriched material. As mentioned above, the seven values of the baseline signal were averaged, and the standard deviation is used to define the detection limit. All of the unenriched samples fell within the three standard deviation limit.
Three 1 ml samples containing 2.48 ng of enriched caffeine and 283 ng of unenriched caffeine were injected next. The enrichment-only signal of each of these samples was also within three standard deviations above the mean baseline, indicating that this level is below the enrichment detection limit. Next, three samples containing 12.4 ng enriched caffeine in the same amount of unenriched material were injected. All three samples gave signals greater than the mean-plus-3 S.D. limit and were thus considered within the detection limits of the instrument.
Results
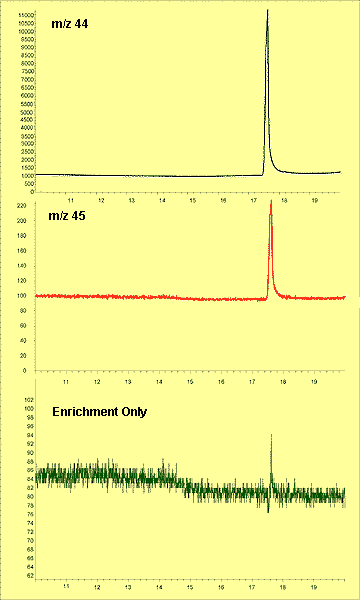
Figure 2 Extracted Ion Chromatograms of m/z 44 (blue), m/z 45(red) and Enrichment-Only (green) for Unenriched Sample
The enriched caffeine used (Cambridge Isotope Labs, Inc.) contained 13C enriched to 99.9% on one of the eight carbons in the molecule. The detected enrichment was therefore approximately 0.65 atom %. In terms of the established nominal isotopic ratio, d13C = 261.6.
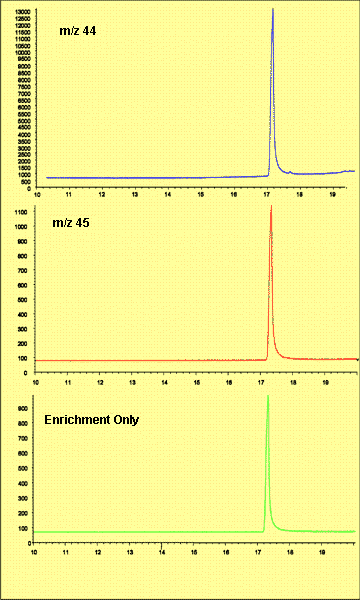
Figure 3. Extracted Ion Chromatograms For Sample with High Degree of Enrichment (310 ng 13C caffeine, 283 ng 12C caffeine)
These values were also calculated by integrating the selected ion chromatograms for m/z 44 and 45. The signal for m/z 45 was first multiplied by 100 to allow consistent integration of peaks in both traces, and the ChemStation autointegration feature was used to determine peak areas. Peak areas for the different ions were compared directly to give percent enrichment. This method of calculation gave highly reproducible ratios for the samples tested. Interestingly, the samples with less enrichment, while very tightly grouped by the integration method, gave ratio values that were lower than the unenriched standard material. This may be due to the fact that the enriched samples were run the day after the control samples, and the anomaly may reflect differences in instrument tuning or CRIMS chemistry. However, one unenriched sample was run as a system stability check on the same day and its ratio agreed with those run previously. Data is summarized in Table 1.
Table 1. Summary of Enrichment Sensitivity Data
| Sample 12C/13C (ng/ml) | Nominal Value(abundance units) | Ratio by Integration (% 13C) | |
| 565/0 | 77 | 1.33 | |
| 565/0 | 165 | 1.19 | |
| 377/0 | 65 | 1.25 | |
| 226/0 | 35 | 1.23 | |
| 283/0 | 99 | 1.23 | |
| 283/0 | 152 | Mean : 89.9 | 1.32 |
| 283/0 | 36 | 3 x S.D: + 156.2 | 1.23 |
| Detection Threshold: 246.1 | Mean:1.25 | ||
| 283/2.48 | 156 | 1.18 | |
| 283/2.48 | 87 | 1.18 | |
| 283/2.48 | 97 | 1.15 | |
| 283/12.4 | 405 | 1.56 | |
| 283/12.4 | 250 | 1.56 | |
| 283/12.4 | 376 | 1.64 |
Conclusions
Measurement of the sensitivity of a CRIMS system to isotopic enrichment requires enough material to overcome random baseline noise and display appropriate isotope ratios with unenriched material. GC-CRIMS is very sensitive to slight enrichment of 13C, and results can be obtained with high precision.
Other factors that affect the sensitivity of a CRIMS system range from the obvious steps of optimizing the tuning parameters and eliminating sources of chemical background to more involved tasks of selecting Selected Ion Monitoring parameters for optimum dwell time and scan rates. Correct plasma conditions are also a factor. Inappropriate amounts of reagent gas or overloaded samples can quench the plasma or alter the CRIMS chemistry, resulting in lower sensitivity and unreliable results.
References
1. Abramson, F.P. 1994. CRIMS: Chemical Reaction Interface Mass Spectrometry. Mass Spectrometry Reviews. 13, 341-356.
2. Song, H., Kusmierz, J., and Abramson, F. 1994. Implementation of the Chemical Reaction Interface Mass Spectrometry Technique on a Hewlett-Packard Mass-Selective Detector. J. Am. Soc. Mass Spectrom. 5, 765-771.
3. Kusmierz, J.J., and Abramson, F.P., 1993. Improved Measurement of Stable Isotope Ratios in GC-MS using CRIMS. Biol. Mass Spectrom. 22, 537-543.
4. Using CRIMS to Monitor Bacterial Transport in in situ Bioremediation. DeFlaun, M., Fuller, M., Thomas, A., Butrym, E., Colby, S. and Onstott, T. Poster presentation given at Pittcon '98 New Orleans, LA March 1-6, 1998.

