- ▶
- Heaters/Source
- ▶
- Agilent Heaters and SensorsMass Spectrometry, Scientific Supplies & ManufacturingScientific Instrument Services 5973 Source Heater Tamper Resistant Allen Wrench 5973/5975 Quad Sensor 5985 Source Heater Assembly Agilent Interface Heater Assembly 5971 Interface Heater
- ▶
- TD
- ▶
- AccessoriesTD Supply Kit Desorption Tubes Adsorbent Resins Desorption Tube Needles Desorption Tube Seals Desorption System Fittings GC Cryo-Trap Extraction Cell TD Sample Loader Prepacked, Conditioned Desorption Tubes Desorption Tube Packing Accessories Stainless Steel Purge Heads Injection Port Liners Tenax TA Poster TD Application Notes Customer Service
- LiteratureApplication Notes Adsorbent Resins Guide Mass Spec Tips SDS Sheets FAQ MS Calibration Compound Spectra Manuals MS Links/Labs/ Organizations MS Online Tools Flyers on Products/Services Scientific Supplies Catalog About Us NextAdvance Bullet Blender® Homogenizer Protocols Micro-Mesh® Literature Instrumentation Literature Agilent GC/MS Literature SIS News / E-Mail Newsletter NIST MS Database - Update Notifications

- ▶
- Application NotesNote 103: EPA Method 325B, Novel Thermal Desorption Instrument Modification to Improve Sensitivity Note 102: Identification of Contaminants in Powdered Beverages by Direct Extraction Thermal Desorption GC/MS Note 101: Identification of Contaminants in Powdered Foods by Direct Extraction Thermal Desorption GC/MS Note 100: Volatile and Semi-Volatile Profile Comparison of Whole Versus Cracked Versus Dry Homogenized Barley Grains by Direct Thermal Extraction Note 99: Volatile and Semi-Volatile Profile Comparison of Whole vs. Dry Homogenized Wheat, Rye and Barley Grains by Direct Thermal Extraction GC/MS Note 98: Flavor and Aroma Profiles of Truffle Oils by Thermal Desorption GC/MS Note 97: Flavor Profiles of Imported and Domestic Beers by Purge & Trap Thermal Desorption GC/MS Note 96: Reducing Warping in Mass Spectrometer Filaments, with SISAlloy® Yttria/Rhenium Filaments Note 95: Detection of Explosives on Clothing Material by Direct and AirSampling Thermal Desorption GC/MS Note 94: Detection of Nepetalactone in the Nepeta Cataria Plant by Thermal Desorption GC/MS Note 93: Detection of Benzene in Carbonated Beverages with Purge & Trap Thermal Desorption GC/MS Note 92: Yttria Coated Mass Spectrometer Filaments Note 91: AutoProbe DEP Probe Tip Temperatures Note 90: An Automated MS Direct Probe for use in an Open Access Environment Note 89: Quantitation of Organics via a Mass Spectrometer Automated Direct Probe Note 88: Analysis of Silicone Contaminants on Electronic Components by Thermal Desorption GC-MS Note 87: Design and Development of an Automated Direct Probe for a Mass Spectrometer Note 86: Simulation of a Unique Cylindrical Quadrupole Mass Analyzer Using SIMION 7.0. Note 85: Replacing an Electron Multiplier in the Agilent (HP) 5973 MSD Note 84: Vacuum Pump Exhaust Filters - Charcoal Exhaust Traps Note 83: Vacuum Pump Exhaust Filters - Oil Mist Eliminators Note 82: Vacuum Pump Exhaust Filters Note 81: Rapid Bacterial Chemotaxonomy By DirectProbe/MSD Note 80: Design, Development and Testing of a Microprocessor ControlledAutomated Short Path Thermal Desorption Apparatus Note 79: Volatile Organic Compounds From Electron Beam Cured and Partially Electron Beam Cured Packaging Using Automated Short Path Thermal Desorption Note 78: A New Solution to Eliminate MS Down-Time With No-Tool-Changing of Analytical GC Columns Note 77: The Determination of Volatile Organic Compounds in VacuumSystem Components Note 76: Determination of the Sensitivity of a CRIMS System Note 75: An Apparatus for Sampling Volatile Organics From LivePlant Material Using Short Path Thermal Desorption Note 74: Examination of Source Design in Electrospray-TOF Using SIMION 3D Note 73: The Analysis of Perfumes and their Effect on Indoor Air Pollution Note 72: 1998 Version of the NIST/EPA/NIH Mass Spectral Library, NIST98 Note 71: Flavor Profile Determination of Rice Samples Using Shor tPath Thermal Desorption GC Methods Note 70: Application of SIMION 6.0 To a Study of the Finkelstein Ion Source: Part II Note 69: Application of SIMION 6.0 To a Study of the Finkelstein Ion Source: Part 1 Note 68: Use of a PC Plug-In UV-Vis Spectrometer To Monitor the Plasma Conditions In GC-CRIMS Note 67: Using Chemical Reaction Interface Mass Spectrometry (CRIMS) To Monitor Bacterial Transport In In Situ Bioremediation Note 66: Probe Tip Design For the Optimization of Direct Insertion Probe Performance Note 65: Determination of Ethylene by Adsorbent Trapping and Thermal Desorption - Gas Chromatography Note 64: Comparison of Various GC/MS Techniques For the Analysis of Black Pepper (Piper Nigrum) Note 63: Determination of Volatile and Semi-Volatile Organics in Printer Toners Using Thermal Desorption GC Techniques Note 62: Analysis of Polymer Samples Using a Direct Insertion Probe and EI Ionization Note 61: Analysis of Sugars Via a New DEP Probe Tip For Use With theDirect Probe On the HP5973 MSD Note 60: Programmable Temperature Ramping of Samples Analyzed ViaDirect Thermal Extraction GC/MS Note 59: Computer Modeling of a TOF Reflectron With Gridless Reflector Using SIMION 3D Note 58: Direct Probe Analysis and Identification of Multicomponent Pharmaceutical Samples via Electron Impact MS Note 57: Aroma Profiles of Lavandula species Note 56: Mass Spec Maintenance & Cleaning Utilizing Micro-Mesh® Abrasive Sheets Note 55: Seasonal Variation in Flower Volatiles Note 54: Identification of Volatile Organic Compounds in Office Products Note 53: SIMION 3D v6.0 Ion Optics Simulation Software Note 52: Computer Modeling of Ion Optics in Time-of-Flight mass Spectrometry Using SIMION 3D Note 51: Development and Characterization of a New Chemical Reaction Interface for the Detection of Nonradioisotopically Labeled Analytes Using Mass Spectrometry (CRIMS) Note 50: The Analysis of Multiple Component Drug Samples Using a Direct Probe Interfaced to the HP 5973 MSD Note 49: Analysis of Cocaine Utilizing a New Direct Insertion Probe on a Hewlett Packard 5973 MSD Note 48: Demonstration of Sensitivity Levels For the Detection of Caffeine Using a New Direct Probe and Inlet for the HP 5973 MSD Note 47: The Application Of SIMION 6.0 To Problems In Time-of-Flight Mass Spectrometry Note 46: Delayed Extraction and Laser Desorption: Time-lag Focusing and Beyond Note 45: Application of SIMION 6.0 to Filament Design for Mass Spectrometer Ionization Sources Note 44: The Design Of a New Direct Probe Inlet For a Mass Spectrometer Note 43: Volatile Organic Composition In Blueberries Note 42: The Influence of Pump Oil Purity on Roughing Pumps Note 41: Hydrocarbon Production in Pine by Direct Thermal Extraction Note 40: Comparison of Septa by Direct Thermal Extraction Note 39: Comparison of Sensitivity Of Headspace GC, Purge and Trap Thermal Desorption and Direct Thermal Extraction Techniques For Volatile Organics Note 38: A New Micro Cryo-Trap For Trapping Of Volatiles At the Front Of a GC Capillary Column Note 37: Volatile Organic Emissions from Automobile Tires Note 36: Identification Of Volatile Organic Compounds In a New Automobile Note 35: Volatile Organics Composition of Cranberries Note 34: Selection Of Thermal Desorption and Cryo-Trap Parameters In the Analysis Of Teas Note 33: Changes in Volatile Organic Composition in Milk Over Time Note 32: Selection and Use of Adsorbent Resins for Purge and Trap Thermal Desorption Applications Note 31: Volatile Organic Composition in Several Cultivars of Peaches Note 30: Comparison Of Cooking Oils By Direct Thermal Extraction and Purge and Trap GC/MS Note 29: Analysis Of Volatile Organics In Oil Base Paints By Automated Headspace Sampling and GC Cryo-Focusing Note 28: Analysis Of Volatile Organics In Latex Paints By Automated Headspace Sampling and GC Cryo-Focusing Note 27: Analysis of Volatile Organics In Soils By Automated Headspace GC Note 26: Volatile Organics Present in Recycled Air Aboard a Commercial Airliner Note 25: Flavor and Aroma in Natural Bee Honey Note 24: Selection of GC Guard Columns For Use With the GC Cryo-Trap Note 23: Frangrance Qualities in Colognes Note 22: Comparison Of Volatile Compounds In Latex Paints Note 21: Detection and Identification Of Volatile and Semi-Volatile Organics In Synthetic Polymers Used In Food and Pharmaceutical Packaging Note 20: Using Direct Thermal Desorption to Assess the Potential Pool of Styrene and 4-Phenylcyclohexene In Latex-Backed Carpets Note 19: A New Programmable Cryo-Cooling/Heating Trap for the Cryo-Focusing of Volatiles and Semi-Volatiles at the Head of GC Capillary Columns Note 18: Determination of Volatile Organic Compounds In Mushrooms Note 17: Identification of Volatile Organics in Wines Over Time Note 16: Analysis of Indoor Air and Sources of Indoor Air Contamination by Thermal Desorption Note 14: Identification of Volatiles and Semi-Volatiles In Carbonated Colas Note 13: Identification and Quantification of Semi-Volatiles In Soil Using Direct Thermal Desorption Note 12: Identification of the Volatile and Semi-Volatile Organics In Chewing Gums By Direct Thermal Desorption Note 11: Flavor/Fragrance Profiles of Instant and Ground Coffees By Short Path Thermal Desorption Note 10: Quantification of Naphthalene In a Contaminated Pharmaceutical Product By Short Path Thermal Desorption Note 9: Methodologies For the Quantification Of Purge and Trap Thermal Desorption and Direct Thermal Desorption Analyses Note 8: Detection of Volatile Organic Compounds In Liquids Utilizing the Short Path Thermal Desorption System Note 7: Chemical Residue Analysis of Pharmaceuticals Using The Short Path Thermal Desorption System Note 6: Direct Thermal Analysis of Plastic Food Wraps Using the Short Path Thermal Desorption System Note 5: Direct Thermal Analysis Using the Short Path Thermal Desorption System Note 4: Direct Analysis of Spices and Coffee Note 3: Indoor Air Pollution Note 2: Detection of Arson Accelerants Using Dynamic Headspace with Tenax® Cartridges Thermal Desorption and Cryofocusing Note 1: Determination of Off-Odors and Other Volatile Organics In Food Packaging Films By Direct Thermal Analysis-GC-MS Tech No. "A" Note 14: Elimination of "Memory" Peaks in Thermal Desorption Improving Sensitivity in the H.P. 5971 MSD and Other Mass Spectrometers - Part I of II Improving Sensitivity in the H.P. 5971 MSD and Other Mass Spectrometers- Part II of II Adsorbent Resins Guide Development and Field Tests of an Automated Pyrolysis Insert for Gas Chromatography. Hydrocarbon Production in Pine by Direct Thermal Extraction A New Micro Cryo-Trap for the Trapping of Volatiles at the Front of a GC Capillary (019P) - Comparison of Septa by Direct Thermal Extraction Volatile Organic Composition in Blueberry Identification of Volatile Organic Compounds in Office Products Detection and Indentification of Volatiles in Oil Base Paintsby Headspace GC with On Column Cryo-Trapping Evaluation of Septa Using a Direct Thermal Extraction Technique INFLUENCE OF STORAGE ON BLUEBERRY VOLATILES Selection of Thermal Desorption and Cryo-Trap Parameters in the Analysis of Teas Redesign and Performance of a Diffusion Based Solvent Removal Interface for LC/MS The Design of a New Direct Probe Inlet for a Mass Spectrometer Analytes Using Mass Spectrometry (CRIMS) Application of SIMION 6.0 to Filament Design for Mass Spectrometer Ionization Sources A Student Guide for SIMION Modeling Software Application of SIMION 6.0 to Problems in Time-of-flight Mass Spectrometry Comparison of Sensitivity of Headspace GC, Purge and TrapThermal Desorption and Direct Thermal Extraction Techniques forVolatile Organics The Influence of Pump Oil Purity on Roughing Pumps Analysis of Motor Oils Using Thermal Desorption-Gas Chromatography-Mass Spectrometry IDENTIFICATION OF VOLATILE ORGANIC COMPOUNDS IN PAPER PRODUCTS Computer Modeling of Ion Optics in Time-of-Flight mass Spectrometry using SIMION 3D Seasonal Variation in Flower Volatiles Development of and Automated Microprocessor Controlled Gas chromatograph Fraction Collector / Olfactometer Delayed Extraction and Laser Desorption: Time-lag Focusing and Beyond A New Micro Cryo-Trap for the Trapping of Volatiles at the Front of a GC Column Design of a Microprocessor Controlled Short Path Thermal Desorption Autosampler Computer Modeling of Ion Optics in Time-of-Flight Mass Spectrometry Using SIMION 3D Thermal Desorption Instrumentation for Characterization of Odors and Flavors

- ▶
- Adsorbent ResinsTenax® TA Adsorbent Resin Tenax®-GR Adsorbent Resin for Trapping Volatiles Carbotrap Adsorbent Resin Physical Properties Carbotrap C Adsorbent Resin Physical Properties Carboxen 569 Adsorbent Resin Physical Properties Carbsieve SIII Adsorbent Resin Physical Properties Glass Beads Adsorbent Resin Physical Properties Determination and Use of Breakthrough Volume Data Tenax® TA Breakthrough Volume Data Tenax® GR Breakthrough Volume Data Carbotrap Breakthrough Volume Data Carbotrap C Breakthrough Volume Data Carboxen 569 Breakthrough Volume Data Carbosieve SIII Breakthrough Volume Data Glass Beads Breakthrough Volume Data Hydrocarbon Breakthrough Volumes for Adsorbent Resins Alcohol Breakthrough Volumes for Adsorbent Resins Alkene Breakthrough Volumes for Adsorbent Resins Acetate and Acid Breakthrough Volumes for Adsorbent Resins Aldehyde and Ketone Breakthrough Volumes for Adsorbent Resins Halogen Breakthrough Volumes for Adsorbent Resins Amine Breakthrough Volumes for Adsorbent Resins Aromatics and Terpenes Breakthrough Volumes for Adsorbent Resins Water Breakthrough Volumes for Adsorbent Resins Tenax® TA Back Pressure Versus Flow Data Tenax® GR Back Pressure Versus Flow Data Carbotrap and Carbotrap C Back Pressure Versus Flow Data Carbosieve SIII Back Pressure Versus Flow Data
- ▶
- Determination and Use of Breakthrough Volume DataDefinition of Breakthrough Volume Calculation and Use of Breakthrough VolumeData Determination of Breakthrough Volume Example of the Use of Breakthrough Volume Data Determination of Back Pressure Data for Adsorbent Resins How to Select an Adsorbent Resin for an Application Use of Mixed Resin Beds Preparation and Conditioning of Desorption Tubes and ResinBeds Note 32: Selection and Use of Adsorbent Resins for Purge and Trap Thermal Desorption Applications Other References on Adsorbent Resins

- ▶
- Calculation and Use of Breakthrough VolumeData (This Page)
John J. Manura, Scientific Instrument Services, Ringoes, NJ
Introduction
Adsorbent resins are widely used for applications including air sampling as well as the Purge and Trap (P&T) sampling of liquid and solid matrix samples and are part of the accepted EPA methods for water and air testing. Gas (air) samples, as well as the volatiles purged from liquid and solid samples, are passed through desorption tubes packed with adsorbent resins where the organic compounds are trapped on the adsorbent resin. The trapped organics can then be thermally desorbed into a GC or GC/MS for subsequent analysis.
In selecting the preferred adsorbent resin for a particular application one must consider a wide range of physical and chemical properties of both the adsorbent resin as well as the analytes to be trapped and analyzed. For the selection of an adsorbent resin, the manufacturers tables of breakthrough volumes of analytes on a resin are normally referenced. This data is useful for the determination of the trapping efficiency of the analytes on the resin at room temperature. Previous publications have described methods to determine breakthrough volumes and have presented data on the breakthrough volumes of a number of organic compounds (1 - 14). However most published data on breakthrough volumes has only been published at room temperature (20 degrees C). Little data has been published on breakthrough volumes at elevated temperature and no data has been published on breakthrough volume data as a function of temperature in a format that can be easily used for the selection of both adsorption and desorption parameters for the adsorbent resins. This data is necessary for the practical use of adsorbent resins for the trapping of analytes in the adsorption process at temperatures other than room temperature as well as the thermal extraction of the analytes off the adsorbent resin during the desorption process.
This article will describe the methods of the determination of breakthrough volume data as a function of temperature and the use of breakthrough volume data for the proper selection of the experimental parameters for the use of adsorbent resins. Other articles will describe the physical characteristics of adsorbent resins for a large number of organic compounds including hydrocarbons, aromatics, aldehydes, ketones, amines, halogens, alcohols, terpenes and organic acids. More than 200 organic compounds will be evaluated on at least 7 different adsorbent resins. The data herein is presented in a usable format which will permit a quick and easy selection of the adsorbent resin, enable the selection of sample collection parameters, and determine the optimum desorption parameters for the use of adsorbent resins in purge and trap thermal desorption applications. The use of the breakthrough volume data will be explained to point out possible inaccuracies in the use of the data due to sample overloading, analyte competition for adsorbent resin active sites, effect of water, effect of desorption tube diameter and sampling flow velocity. Finally the volumes of adsorbent resins that can be packed into desorption tubes will be studied to determine the back pressures that can be created at various flow rates through the desorption tube. This data will determine the maximum amount of adsorbent resin that can be packed into a desorption tube as well as the maximum flow rate of gas that can be sampled through the desorption tube without physical damage to the air sampling pump.
Breakthrough Volume - A Definition
Figure 1 - Elution of Analytes from Adsorbent Resin
The term breakthrough volume (1-14) has also been referred to as retention volume (EPA Method TO-1, and References 4 and 9) and also the specific retention volume (1). The units of breakthrough volume are usually expressed as liters/gram, milliliters/gram and milliliters/milliliter. We will standardize on the units of liters/gram (liters of gas per gram of adsorbent resin) for breakthrough volumes greater than 1.0 liter/gram. When breakthrough volumes are less than 1.0 liter/gram we will use the units of mL/gram (milliliters of gas per gram of adsorbent resin). The term breakthrough volume is defined as the calculated volume of carrier gas per gram of adsorbent resin which causes the analyte molecules to migrate from the front of the adsorbent bed to the back of the adsorbent bed (1,4). This definition can be explained more clearly with the use of Figure # 1. In this diagram a desorption tube is packed with a known weight of adsorbent resin with glass wool plugs at both ends to hold the adsorbent resin in place. This resin bed now can be visualized much like a GC column in which an analyte is injected onto the front of the resin bed and then purged with carrier gas to elute the analyte out the opposite end of the resin bed. If carrier gas is purged through the adsorbent resin bed at a constant flow rate and the analytes detected upon elution at the end of the resin bed, a GC chromatogram type peak will be detected. The top of this peak corresponds to the retention time which caused the analyte to migrate from the front of the resin bed and out the opposite end. Multiplying this retention time by the flow rate through the packed resin bed produces the gas volume which caused the analyte to migrate through the resin bed. Dividing this gas volume by the weight of the adsorbent resin packed in the tube produces the breakthrough volume (Bv) data. This peak shown in Figure # 1 is gaussian in shape and broadens as it migrates through the resin bed much like a packed GC column. In summary the breakthrough volume is defined as the gas volume which causes an analyte to migrate through the adsorbent resin bed divided by the weight of adsorbent resin.
This model (Figure # 1) will be used for the determination of the breakthrough volume data as described below. Other authors have suggested that this method may not be valid and they have developed other methods for the determination of breakthrough volume data (4). Our model assumes that a small narrow plug of the analyte migrates through the adsorbent resin bed. While this may be possible when injecting internal standards or liquid samples onto the resin bed, it is not the case when collecting air samples or purging gas samples from liquid or solid samples. In these cases, the analytes are continuously added over a period of time and the peak shown in Figure #1 will be much broader. If the sample is collected long enough, it is possible to purge the analytes off one end of the resin bed while they are still being collected at the front end of the resin bed. However for our study the model described above is practical for the determination of the breakthrough volume data and can be utilized to predict the behavior of the analytes on the adsorbent resin. The data that is really important in the gas volume at which the analyte is first eluted off the adsorbent resin bed (Bs) (see Figure 3). This gas value is called the safe sample volume (4 & 11) or initial elution volume (8). When collecting samples onto the adsorbent resin bed, this safe sample volume (l/gr) should not be exceeded in order to trap all the analyte on the adsorbent resin bed. The second data value that is important in the complete sample elution volume (Bf). This is the gas volume at a particular temperature at which the sample will be completely eluted off the adsorbent resin bed. Both of these gas volumes per gram of resin can be predicted from the breakthrough volume data that is determined via the model described above.
Experimental Determination of Breakthrough Volumes
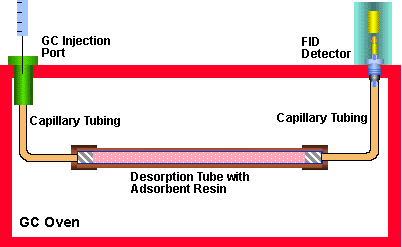
Figure 2 - Determination of Breakthrough Volumes of Adsorbent Resins
In order to accurately determine the breakthrough volumes as a function of temperature, the system as shown in Figure # 2 was assembled. A similar system has been previously described by Supelco (1) where it was used to determine the breakthrough volumes for a number of compounds. A glass lined stainless steel tube (1/4" O.D. x 4.0 mm I.D. x 100 mm long) was packed with an accurately weighed quantity of adsorbent resin (250 milligram to 1.000 gram) and sealed at both ends with glass wool plugs to construct the adsorbent resin bed. Stainless steel connecting lines (1/16" O.D. x 0.020" I.D.) were connected to both ends of the adsorbent resin bed. One of these lines was connected to the injection port of a Varian 3400 GC and the other end to the flame ionization detector. In essence we have made a GC column using the adsorbent resin as the column packing. Helium was used as the carrier gas and carrier gas flows were accurately adjusted from 5.0 mL/min up to 500 mL/min. The carrier gas flows were adjusted and measured using a primary flow calibrator (Gilibrator TM, Gilian Instruments) which accurately measured flows to within 0.1 mL/min. Likewise the GC column oven temperature was accurately controlled to within 0.5 degrees C using the GC oven temperature controller. The accurate measuring of adsorbent resin bed volume, carrier gas flow and oven temperature are necessary for the accurate determination of breakthrough volumes.
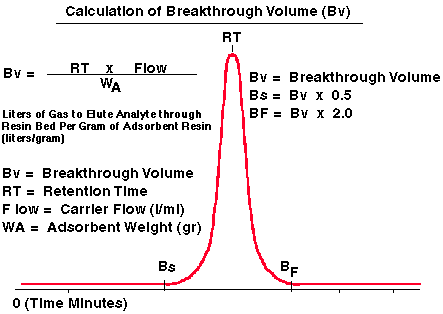
Figure 3 - Calculation of Breakthrough Volumes
GC oven temperatures between 0 and 360 degrees C were selected at 20 degree increments in order to determine the breakthrough volumes as a function of temperature. Approximately one microgram of each of the more than 200 analytes studied were injected into the GC injection port. The carrier gas flow was adjusted between 5.0 mL/min and 500 mL/min to obtain a retention time between 0.1 min and 3.0 minutes. The temperature, carrier gas flow rates and retention time were recorded. From this data the breakthrough volume for the analyte studied was calculated for the particular temperature as shown in Figure # 3. The retention time in minutes was multiplied by the carrier gas flow in mL/min and this was divided by the weight of the adsorbent resin. A correction was made for dead volume of the packed adsorbent resin and connecting lines. This dead volume was determined by injecting a non retained analyte into the GC injection port and calculating its retention volume. For most resins this dead volume was about 2.0 mL. (0.002 liter). All samples were run in triplicate at each temperature and flow and at least 7 different temperatures were studied for each of the analytes. More than 200 analytes were studied on seven different adsorbent resins. In all more than 20,000 injections were made over the course of more than a year in order to study the breakthrough volumes as a function of temperature for these 7 adsorbent resins. The true calculation of Breakthrough volume can be summarized as follows:

where:
| Bv = | Breakthrough volume in Liters/gram (L/gr) |
| RT = | Retention Time of Analyte in Minutes (min) |
| Flow = | Carrier Gas Flow in Milliliters/min (mL/min) |
| DV = | Dead Volume in Milliliters (mL) |
| Wa = | Weigh of Adsorbent Resin in Grams (gr) |
| 1000 mL/liter = | Conversion factor to convert data from mL/gr to L/gr |
The breakthrough volume corresponds to the maximum of the chromatographic curve as demonstrated in Figure # 3. However it is important to note that the elution peak is gaussian in shape. The analyte first begins to elute from the adsorbent resin at a carrier gas volume of Bs (safe sample volume) and is totally eluted from the resin bed at a carrier gas volume of Bf (complete sample elution volume). If the breakthrough volume data is being used for the adsorption of an analyte onto the resin bed, then the value Bs must be used so as not to purge off any of the analyte during the sampling step. In a likewise manner, if the user is using the breakthrough volume data to purge or desorb the analytes off the adsorbent resin, then the value Bf must be used to assure complete desorption of the analyte off the adsorbent resin. The width of the peak (and therefore the values for Bs and Bf) are a function of sample volume injected. For our model we assume the sample size to be small and the peak width narrow. Other authors have determined that the values of Bs and Bf should be selected where the peak height is between 1.5% (8) and 5% (4 and 11) of the maximum peak height. As a general rule this corresponds to a Bs value of about 0.5 (4 and 11) times the calculated Breakthrough volume and the Bf value of 2 to 3 times the calculated breakthrough volume for analytes between 1 and 500 nanograms. Higher concentration of samples or overloaded samples will distort these calculations.
Safe Sample Collection Volume (Adsorption or Initial Elution Volume)
Bs = Bv x 0.5 Complete Sample Elution Volume (Thermal Desorption)
Bf = Bv x 2.0
These Bs and Bf correction values to the breakthrough volumes should always be used in order to avoid loss of analytes on the adsorbent resin and to avoid errors in your analytical sampling and data calculation during adsorption and desorption of analytes on the adsorbent resin.
The above description assumes that the compound "likes" the adsorbent resin as a stationary phase. If it does the peak shape as described in the model is gausian. If not the peak may tail, much like the analysis of a polar hydroxy compound on a non polar GC column. If the peak tails, then the complete elution volume Bf value may be higher than that predicted above. Therefore the 3.0 times factor is normally used to assure complete extraction of the analytes from the adsorbent resin.
There are several other parameters which may distort or alter the breakthrough volume calculations described above. When collecting samples continuously, the analyte is not put onto the adsorbent resin bed in a nice small plug, but is collected over a period of time in a broad band, the width of which is controlled by the affinity of the resin for the analyte of interest. Therefore when the sample is continuously added to the adsorbent resin bed, there can be competition for the active sites of the adsorbent resin (3 and 4). This will cause the breakthrough volume to be less than that determined above. The same effect can occur with sample overloading (4). This factor must be considered when collecting samples. It can cause the Bs value to be less than that predicted above. The effect is not normally more than a 10% error. This overloading and competition of analytes on adsorbent resins is thoroughly discussed elsewhere (3 and 4). The effect of water in the samples has also been investigated by several authors (4, 5 and 8). The consensus of most investigators is that the effect of water is negligible as long as it is kept in the gas phase. The effect of water can be compared to the effect of competing analytes on the adsorbent resin. However if the water were to condense out of the gas phase, it can saturate the adsorbent resin and lend it useless as an adsorbent resin. It is therefore important to keep the water vapor in the gas phase. When purging hot samples onto a cooler adsorbent resin, a make-up gas or dry purge gas is normally mixed with the purging gas just before it enters the adsorbent resin. The purpose of the dry makeup gas is to reduce the relative humidity of the gas before it enters the desorption tube, preventing the water from condensing in the adsorbent resin inside the trap. A dry make up gas should always be used with the purge and trap of liquid samples, particularly if they are heated.
The breakthrough volume data can also be effected by the velocity of the gas during sampling (8 and 11). In the sample tubes with diameters up to 4.0 mm, flow rates up to 250 mL/min can be used with no flow induced effects. At much higher flow rates, the breakthrough volumes would be less. This is understandable, since the analytes will be flying through the adsorbent at rates which do not permit them to interact with the pores of the adsorbent resin. The net result of excessive flow rates will be lower breakthrough volume data. This is fully described elsewhere (11).
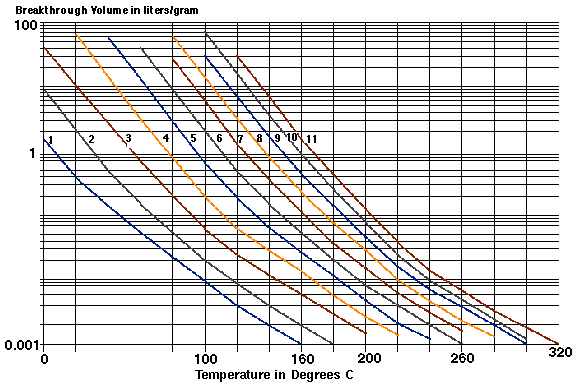
Figure 4 - Breakthrough Volume Plot for Alcohols on Tenax® TA
In Figure # 4 the experimentally calculated breakthrough volumes for the primary alcohols Methanol (C1-OH) through Undecanol (C11-OH) are plotted at temperatures between 0 degrees C and 320 degrees C. In this chart the temperature of the adsorbent resin is plotted on the x-axis and the log of the breakthrough volume was plotted on the y-axis. Normally the x axis is represented as the reciprocal of the absolute temperature (1,6, and 8) which will produce straight line plots as theoretically predicated (5 and 8). However using such plots where the temperature is represented as a reciprocal number renders these charts difficult to use to predict the breakthrough volume at a particular temperature. In the chart plotted in Figure # 4, a minimum of 7 temperature and breakthrough volume points were plotted for each analyte. These plots are relatively linear plots on the graphs and the plots could easily be extrapolated to predict breakthrough volumes for temperatures not determined experimentally. This chart demonstrates the decrease in breakthrough volumes as the temperature of the adsorbent resin increases. From this chart it can be seen that the breakthrough volume for Methanol is about 0.4 L/gram (400 mL/gram) at 20 degrees C. Using the Bs value correction described above, it is determined that in order to collect an air sample onto a Tenax TA resin bed, the analyst should not sample a gas volume greater than 200 milliliters per gram of adsorbent resin (400 mL/gr x 0.5). If larger gas samples are purged through the adsorbent resin bed, analyte would be exiting the end of the adsorbent resin bed at the same time it is being added at the front end of the resin bed producing unreliable results, particularly if quantification of the analyte is important. The results above assume the use of 1.0 gram of adsorbent resin. In many cases smaller adsorbent resin bed volumes are used, and the breakthrough volume data should be divided by the appropriate value. For example if the adsorbent resin bed contains 100 milligrams of resin, then when sampling Methanol only 20.0 mL of air sample (200 mL/gram x 0.100 gram) can be sampled without the loss of the Methanol. Using the breakthrough volume data enables the analyst to determine the gas volume that can be analyzed with the resin without purging the analyte off the resin bed during sample collection.
For the complete thermal extraction or elution of an analyte off the adsorbent resin the Bf value must be determined for the analytes on the adsorbent resin. If a breakthrough volume of 0.005 Liter/gram is selected as the maximum parameter for the elution of the analytes from the adsorbent, then using the Bf value correction described above, we would need to desorb the adsorbent resin bed with 15 milliliters of carrier gas to totally purge the analytes from the resin bed (5.0 mL x 3). From the chart a temperature of 118 degrees C predicts a breakthrough volume for Methanol of 0.005 L/gram. Therefore using a desorption temperature of 118 degrees C or higher and a purge gas volume of 15 mL or more will totally elute the Methanol off the adsorbent resin. Using these calculated values, permits the analyst to obtain the desorption results required at the lowest temperatures possible to achieve complete elution of the analytes of interest.
Also apparent from Figure # 4 is the progressive increase in breakthrough volumes as the molecular weight of the primary alcohol increases. For each increase in the number of carbons in the alcohol, the Breakthrough volume for the alcohol increases by a factor of 4 to 5 times at room temperature. This increases the volume of gas that can be sampled at room temperature to trap these larger alcohols as compared to Methanol. For example the breakthrough volume for Butanol at room temperature is 64 liters/gram of resin, therefore 32 liters of air could be sampled per gram of resin before the Butanol will begin to elute off the adsorbent resin bed (64 l/gr x 0.5) as compared to 200 mL for Methanol. This improves the detection limit for the alcohols in air for the higher boilers.
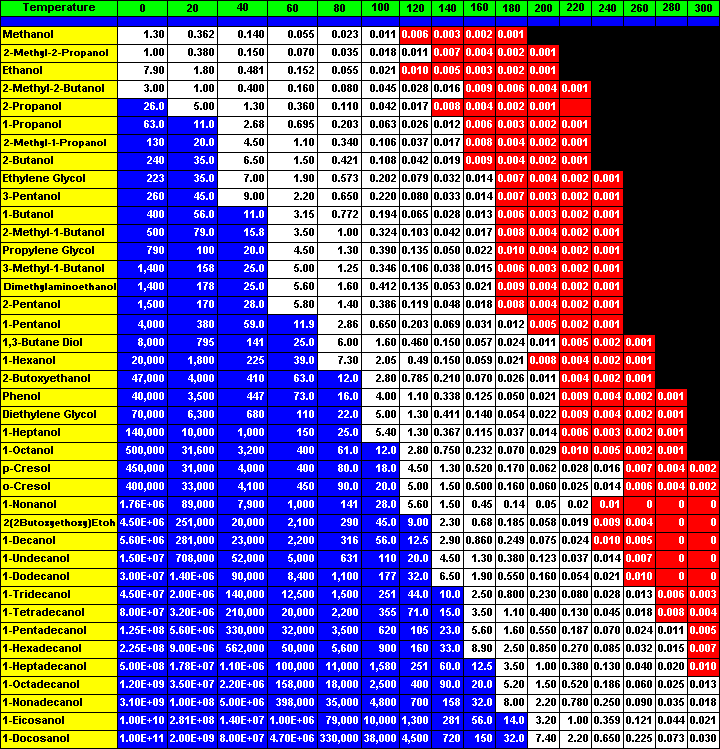
Figure 5 - Breakthrough Volumes of Alcohols on Tenax TA
However the data as presented in Figure # 4 is somewhat cumbersome to use when attempting to determine the adsorption and desorption characteristics for the adsorbent resin as a function of temperature for a number of compounds. The data has been reformatted and printed in tabular form in Figure # 5. This chart displays the breakthrough volumes for all the alcohols on the adsorbent resin Tenax TA. The alcohols are listed in the far left hand column and the breakthrough volumes at the various temperatures are listed in subsequent columns.
In order to select an adsorbent resin for the analysis of a particular analyte the breakthrough volume for that particular analyte must be considered at both the adsorption temperature as well as the desorption temperature. For a particular application such as indoor air testing, use an adsorbent resin with a breakthrough volume of at least 10 Liters per gram of adsorbent resin. Again using our safe breakthrough volume calculation (Bs) this means that the analyst can purge 5.0 Liters through 1.0 gram of the adsorbent resin bed without the loss of any of the analyte passing through the desorption tube. Therefore as shown in Figure 5, the analyte breakthrough volumes that are greater than 10.0 Liters/gram are shaded dark blue with white numbers. Now by quickly looking at the table it is easy to visualize the applicability of the adsorbent resin for the trapping of the analytes or series of analytes at a particular temperature and gas sampling volume.
Likewise in order to thoroughly desorb the analyte from the adsorbent resin, a breakthrough volume of less than 0.010 Liter/gram (<10 mL/gram) of carrier gas is required. Again using the Bf value, this means that 30 mL of carrier gas per gram of adsorbent resin will be required to totally purge the analyte off the adsorbent resin bed. In Figure # 5, the breakthrough volume values that are less than 0.010 Liters per gram are highlighted with a red background and white lettering. Now the user can quickly verify the desorption temperature that is required to elute the analyte or group of analytes off the adsorbent resin bed.
Using this table as displayed in Figure #5, one can easily and conveniently predict the analytes that can be trapped on the adsorbent resin at a particular temperature. It is easy to use the table to determine the volume of gas that will be needed to selectively purge an analyte off the adsorbent resin to remove a solvent front or other unwanted volatile. Finally, the breakthrough volume chart can be used to determine the temperature and gas flows that will be required to completely desorb the analytes of interest off the adsorbent resin for subsequent analysis.
Back Pressure and Flow Rate Limitations in the Adsorbent Resin Bed
The maximum linear velocity (B) through the adsorbent resin bed should not exceed 500 cm/min. If the velocity is greater than 500 cm/min, the analytes of interest will pass thorough the adsorbent resin too quickly to permit efficient trapping of the volatiles on the adsorbent resin. The maximum flow rates in mL/min through the 3.0 mm and 4.0 mm I.D. desorption tubes for the adsorbent resins can be calculated as follows.

Where:
Qmax is the calculated maximum flow rate in milliliter per minute
r is the radius of the desorption tube in centimeters (I.D.)
B is the linear velocity of gas in centimeters per minute
The maximum sample gas flow rate through the adsorbent resin bed should not exceed 250 mL/min for the 4.0 mm I.D. Desorption tubes and 150 mL/min for the 3.0 mm diameter desorption tubes. Higher flow rates will not permit the efficient trapping of volatiles on the adsorbent resin.
3.0  mm I.D. Tubes       Maximum flow rate  =   150 mL/min
4.0  mm I.D. Tubes       Maximum flow rate  =   250 mL/min
Using flow rates in excess of these values will result in inefficient trapping of the analytes from the gas phase onto the adsorbent resin. The influence of flow rates has been described elsewhere (11). In addition the effect of sampling tube diameter on the effect of breakthrough volumes has also been discussed by other authors (8 and 11). Our data was calculated using 4.0 mm I.D. sample tubes. Using 3.0 mm diameter tubes will have negligible effects on the breakthrough volume data presented.
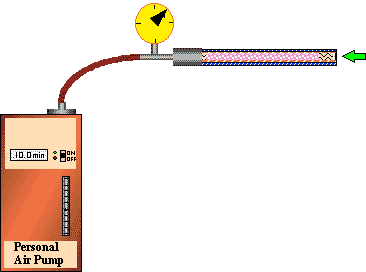
Figure 6 - Determination of Backpressure due to adsorbent resins
When a desorption tube is packed with adsorbent resin and a gas sample is pumped or pulled through the adsorbent resin bed, a back pressure is created by the adsorbent resin. The back pressure is a function of the particle size of the adsorbent resin, the I.D. of the desorption tube, the length of the adsorbent resin bed (or the bed volume) and the flow rate through the adsorbent resin bed. The back pressure increases rapidly as the rate of flow through the resin bed increases. With very fine mesh adsorbent resins packed tightly into the desorption tube, the back pressure can become high enough so as to put a severe strain on the pump used for the air sampling. Many of the personal hygiene pumps used for desorption air sampling can tolerate back pressures up to 40 inches of water. However, it is recommended that back pressure not exceed 25 inches of water in order to maintain accurate flows through the adsorbent resin bed and to minimize the chance of pump failure and low battery life. A typical chart of the back pressures created at different flows in a desorption tube packed with various amounts of Tenax TA resin, is shown in Figure # 7. The areas where the back pressure exceeds 25 inches of water are shown with red backgrounds in reverse lettering. It is not recommended that these higher back pressures be used with the personal hygiene pumps. However these higher pressures could be used with positive pressure systems such as those used in purge and trap systems. If high back pressure is a problem it can be reduced by using larger I.D. desorption tubes, using less adsorbent resin, using a more porous resin or using lower sampling gas flow rates. The remaining Back Pressure Tables for the other adsorbent resins are located elsewhere in this article.
Tenax TA Back Pressures for 4.0 mm I.D. Desorption Tubes
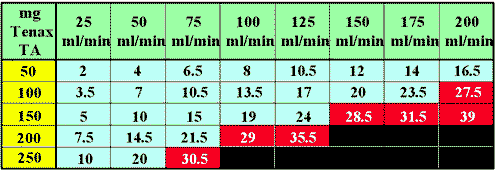
Figure 7 -Back Pressure expressed in inches of water
Sample Collection Parameters for the Adsorption of Volatiles on Adsorbent Resins
When selecting an adsorbent resin for the trapping of volatile analytes a number of physical parameters and characteristics of both the analyte of interest and the adsorbent resin must be taken into consideration. These parameters are outlined in the table below. These properties of the adsorbent resin, the analytes of interest, the sample matrix and interference's are all inter-related and they must all be considered in the selection of an adsorbent resin.
Selection of Adsorbent Resins
Adsorption Parameters- Breakthrough Volumes for Analytes at Sample Collection Temperature
- Range of Organic Analytes to be Sampled
- Gas Volume to be Sampled
- Concentration of Analytes in Gas Sample
- Detection Limits of GC Detector
- Rate of Flow for Sampling and Collection - Time for Sample Collection
- Amount of Adsorbent Resin Bed
- Limitations of Sampling Pump
- Water in Sample and Affinity of Resin for Water
- Temperature and Gas Volume Required to Desorb Analytes
- Range of Analytes to be Desorbed
- Initial Low Temperature Purge to Remove Water and Other Solvents
Adsorption Parameters
We have already discussed the use of the breakthrough volume at the sample collection temperature in order to trap the analytes of interest on the adsorbent resin. Often a wide range of analytes will need to be studied and the breakthrough volumes of more than one analyte may need to be considered. One of the first considerations is the amount of gas volume to be sampled. For example if the volatiles in an indoor air sample were to be studied, the analyst must first determine the minimum levels of analytes that need to be detected, i.e. ppm, ppb. etc. Related to this will be the limits of detection of the GC detector. For example the limits of detection for a mass spectrometer detector may be 1 ng in the full scan mode or 1 pg in the SIM mode. Based on these requirements and limitations, the analyst can determine the air sample size that must be pumped through the desorption tube. Then by knowing the breakthrough volume for the analytes of interest, the amount of adsorbent resin required can be determined. Next the flow rate for sample collection must be determined. This may be controlled by the requirements of the experiment. In some cases one may wish to collect a sample over several hours, in other cases in a matter of minutes. The flow rates through the adsorbent resin must be considered as described above. If a personal hygiene gas sampling pump is to be used, the back pressure created in the desorption tube must be such that it does not put an undue strain on the pump. This may mean a re-evaluation of the adsorbent resin bed volume, desorption tube diameter or gas sampling rate determined above.
Finally the water in the sample must be considered. Water is the enemy in thermal desorption. Many samples contain substantial quantities of water. When the water is desorbed into the GC and cryo-trapped at the front of the GC column, an ice plug can form if too much water is in the sample. There are several techniques that can be used to minimize or eliminate this problem. The first is to use an adsorbent resin such as Tenax TA which has a low affinity for water. If the water in your sample is kept in the gas phase it passes through the Tenax TA resin bed, very little will be retained by the adsorbent resin. The breakthrough volume for water on Tenax TA is 56 mL/gr. Therefore, after your sample has been collected, a dry purge with 168 mL/gram of Tenax Resin will remove the water from the resin bed. Another trick is to use a megabore guard column in the trapping area of the GC. The megabore column has a larger I.D. with more surface area. It will therefore be less likely to form an ice plug than the microbore columns.
For the analysis of a wide range of analytes, mixed bed resins may be required. These mixed bed resins as well as their construction are described elsewhere.
Desorption Parameters
Depending on the range of analytes that the user wishes to detect, the desorption temperature should be selected with the use of the Breakthrough volume tables. The user can have a great deal of control over what level of boiling point compounds appear in the chromatogram by the proper selection of the desorption temperature. However it is preferred to use the lowest desorption temperature that elutes the analytes of interest off the adsorbent resin in order to avoid interference's, avoid sample decomposition and to avoid adsorbent resin decomposition. For example if the alcohols up to octanol were to be analyzed by desorbing off Tenax TA resin, there would be no need to desorb the samples at temperatures greater than 240 degrees C. Higher temperatures would be of no benefit and in fact may complicate the chromatogram. High desorption temperatures results in lower adsorbent life, contributes to a higher GC chromatogram background and increases the analysis time for the samples.
The analyst can also control the range of low boiling volatiles which are injected into the GC. By performing an initial purge of the sample at a lower temperature with a measured gas volume flow, the lower boiling point volatiles can be purged off the adsorbent resin. Then when the sample is desorbed into the GC injection port only the higher boiling point compounds will be detected. This technique is often done at room temperature or slightly higher temperature to remove the solvent front from a sample or from the internal standard injected into the adsorbent resin.
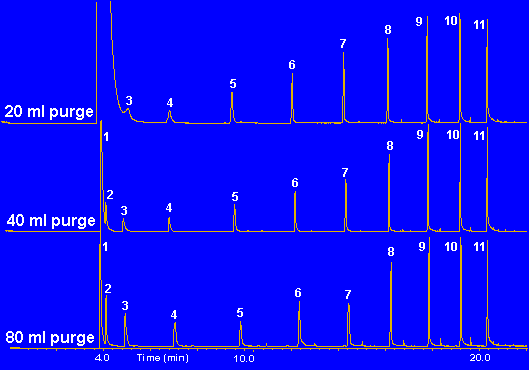
Figure 8 - Purging of a Mixture of Alcohols in Methanol to remove methanol solvent front
An example of this technique to remove the solvent front from a sample is shown in Figure # 8. In this study an equal mixture of the alcohols C2 through C11 were diluted in Methanol to a concentration of 100 ng/ul. One ul of this mix was then injected onto the Tenax TA adsorbent resin bed. The adsorbent resin bed contained 100 milligrams of Tenax TA adsorbent resin. In this experiment it is desired to purge off the methanol from the sample on the resin, while leaving all the other alcohols including ethanol on the adsorbent resin for subsequent analysis. Using the table in Figure #5, the breakthrough volume for Methanol is 0.387 L/gram at room temperature. Our desorption tube contains 100 milligram (0.10 gram) of Tenax TA. Therefore the breakthrough volume for the Methanol on this trap is 0.10 gram x 0.387 L/gram or 0.039 Liters (39 mL). Using our Bf value of 3, this means that a gas purge of about 117 mL should remove the methanol from the trap. Likewise, Ethanol has a breakthrough volume of 2.1 L/gram of Tenax or 210 mL/100 mg of our Tenax bed. Using our Bs value of 0.5 in order to retain all the Ethanol on the resin bed a value of 105 mL of gas purge is calculated. Therefore if we were to purge our Tenax resin bed with greater than 117 mL of gas then the Methanol would be purged off the resin bed, however a small amount of ethanol would also be removed since we exceeded the 105 mL limit required to retain all the ethanol. If a gas volume of less than 105 mL were utilized, then all the ethanol would be retained and a majority of the methanol would be removed from the sample. In the study shown in Figure # 8, 1.0 ul of the sample was injected on the front of the Tenax resin bed, dry purged with the indicated volume of gas and then thermally desorbed into the GC at a thermal desorption temperature of 220 degrees C. The samples were subsequently analyzed on a 60 meter DB5-MS capillary column. As expected from the calculations, increasing purge gas volumes removed the methanol from the sample. The GC peaks for propanol and ethanol were greatly improved by the removal of the Methanol from the chromatogram. Normally these two peaks would have been hidden in the solvent front. Note that the 80 mL purge did not remove all of the Methanol from the sample as predicted. A purge gas volume of 120 mL would be required to remove all the Methanol, but as predicted it will also remove some of the Ethanol from the sample. This technique of purging the sample before analysis is often used to remove solvent fronts from samples which were introduced by the injection of internal standards injected into a sample for quantitation. It is also used to remove solvent fronts so as to detect compounds that would have been hidden in the solvent front. Also by removing the large slug of solvent, the resolution of the early eluting volatile compounds is increased because the solvent flushing or washing effect has been eliminated.
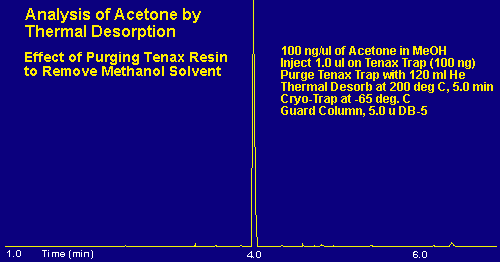
In the example above, a mixture of acetone in methanol solvent was prepared as above and purged with 120 milliliters of nitrogen to remove the methanol. By increasing the purge gas flow to 120 milliliters, the methanol is totally removed from the sample, and 100 percent of the acetone is retained since the breakthrough volume for acetone is 600 mL/100 milligram. Quite often in our analysis of samples we use deuterated internal standards dissolved in methanol solvent in order to quantitate the levels of analytes in our samples. After the sample is collected we inject 1.0 ul of the internal standard in methanol onto the top of the Tenax resin bed and purge the desorption tube with 120 milliliters of nitrogen to totally remove the methanol solvent but retain the internal standard along with the analytes of interest. The samples are subsequently analyzed via the S.I.S. Short Path Thermal Desorption System.
Conclusion
The above discussion demonstrates the determination and use of the breakthrough volume data to achieve optimum results for the use of adsorbent resins for gas sampling and subsequent thermal desorption analysis. The use of breakthrough volume tables as a function of temperature and the back pressure tables for the various resins are valuable pieces of data to help the analyst select the adsorbent resin and the experimental conditions for the analysis of their samples. Other articles discuss individual resins and list these tables for about 200 analytes of various classes of organic compounds including hydrocarbons, aromatics, alcohols, amines, aldehydes, ketones, acids, and esters. In addition various resins are compared in order to help the analyst select the proper resin, or mixture of resins, to achieve optimum results.
References
(1) Betz, W., Maroldo, S., Wachob, G., and Firth, M., Supelco, Inc., Characterization of Carbon Molecular Sieves and Activated Charcoal for Use in Airborne Contaminant Sampling, J. Am. Ind. Hyg. Asoc., 50(4) 181-187.
(2) Carbotrap - An Excellent Adsorbent for Sampling Many Airborne Contaminants. Supelco Reporter. Vol V. No. 1., Supelco, Inc., Bellefonte, PA, 1986, pp 5-7.
(3) Comes, P., Gonzalez-Flesca, N., Menard, T., and Grimalt, J., Langmuir-Derived Equations for the Prediction of Solid Adsorbent Breakthrough Volumes of Volatile Organic Compounds in Atmospheric Emission Effluents., Anal. Chem., Vol. 65, pp 1048-1053 (1993).
(4) Harper, M., Evaluation of Solid Sorbent Sampling Methods by Breakthrough Volume Studies., Ann. Occup. Hyg., Vol. 37, No. 1, pp 65-88 (1993).
(5) Pankow, J., Gas Phase Retention Behavior of Organic Compounds on the Sorbent Poly(oxy-m-terpenyl-2',5'-ylene)., Anal. Chem., Vol. 60, pp 950-958 (1988).
(6) Figge, K., Rabel, W., and Wieck, A., Adsorptionsmettel zur Anreicherung von organischen Luftinhaltsstoffen, Fresenius Z. Anal. Chem., Vol. 327, pp 261-278 (1987).
(7) Kawata, K., Uemura, T., Kifune, I., Tominaga, Y., and Oikawa, K., Breakthrough Volumes of Organic Vapors on Tenax GC Adsorbent, Bunseki Kagaku, Vol. 31, pp 453-457 (1982).
(8) Seshadri, S and Bozelli, J., Collection of Vapors of Selected Chlorocarbons and Benzene on Tenax GC, Chemosphere, Vol. 12, No.6, pp 809-820 (1983).
(9) Zaranski, M and Bidleman, T., High Volume Elution Chromatography of Dichlorobenzenes on a Polyurethane Foam-Tenax Sandwich Cartridge, Journal of Chromatography, Vol. 409, pp 235-242 (1987).
(10) Billings, W. and Bidleman, T., Field Comparison of Polyurethane Foam and Tenax GC for High-Volume Air Sampling of Chlorinated Hydrocarbons., Envir. Sci. Tech., Vol. 14, No. 6, pp 679-683 (1980).
(11) Riba, M., Clement, B., Haziza, M., and Torres, L., Trace Analysis. Determination of the "Breakthrough Volume" (B.Y.V.) of Atmospheric Isoprene, Toxicol. Environ. Chem., Vol. 31-32, pp 235-240 (1991).
(12) Peters, R. and Bakkeren, H., Sorbents in Sampling. Stability and Breakthrough Measurements, Analyst, Vol. 119, pp 71-74 (1994).
(13) Hart, K., Isabelle, L., and Pankow, J., High Volume Air Sampler for Particle and Gas Sampling. 1. Design and Gas Sampling Performance, Environ. Sci. Technol., Vol. 26, pp 1048-1052 (1992).
(14) Staniewski, J. and Rijks, J., Potential and Limitations of Differently Designed Programmed-Temperature Injector Liners for Large-Volume Sample Introduction in Capillary GC, J. High Resolut. Chromatogr., Vol. 16, pp 182-187 (1993).

