- ▶
- Heaters/Source
- ▶
- Agilent Heaters and SensorsMass Spectrometry, Scientific Supplies & ManufacturingScientific Instrument Services 5973 Source Heater Tamper Resistant Allen Wrench 5973/5975 Quad Sensor 5985 Source Heater Assembly Agilent Interface Heater Assembly 5971 Interface Heater

- ▶
- Reference Material on InstrumentationArticle - A High Temperature Direct Probe for a Mass Spectrometer Design of a Direct Exposure Probe and Controller for use ona Hewlett-Packard 5989 Mass Spectrometer SIS AP1000 AutoProbe™ SIS AP2000 AutoProbe™ - Description of System HPP7: Direct Probe Electronics Console HPP7: Direct Probe for the Agilent (HP) 5973/5975 MSD HPP7: HP Direct Probe Application Notes HPP7: Installation Directions for the Direct Probe HPP7: Side Cover for the HP 5973 MSD HPP7: Support HPP7: Probe Inlet System for the Agilent (HP) 5973 and 5975 MSD with Automatic Indexed Stops HPP7: Theory of Operation of the Direct Probe and Probe Inlet System Direct Thermal Extraction Thermal Desorption Application Notes Environmental Thermal Desorption Application Notes Food Science Thermal Desorption Application Notes Forensic Thermal Desorption Application Notes GC Cryo-Trap Application Notes Headspace Application Notes Purge & Trap Thermal Desorption Application Notes Theory of Operation of the AutoDesorb® System AutoDesorb Notes for SIS Dealers Adsorbent Resin Application Notes Installation of the Short Path Thermal Desorption System on Agilent (HP) and Other GCs Installation of the Short Path Thermal Desorption System on a Varian 3400 GC AutoDesorb® System Development Team Thermal Desorption Applications and Reference Materials Installation of the Short Path Thermal Desorption System - TD5 Part I - Design & Operation of the Short Path ThermalDesorption System Installation Instructions for the Model 951 GC Cryo-Trap on the HP 5890 Series GC Installation Instructions for the Model 961 GC Cryo-Trap on the HP 5890 Series GC Operation of the Model 951/961 GC Cryo-Trap SIS GC Cryo Traps - Theory of Operation NIST/EPA/NIH Mass Spectral Enhancements - 1998 version (NIST98) SIMION 3D Ion Optics Class Mass Spectrometer Source Cleaning Methods MS Tip: Mass Spectrometer Source Cleaning Procedures Mass Spec Source Cleaning Procedures Micro-Mesh® Abrasive Sheets Research Papers Using New Era Syringe Pump Systems EI Positive Ion Spectra for Perfluorokerosene (PFK) Cap Liner Information How do I convert between fluid oz and milliliters? Which bottle material should I choose? Which bottle mouth should I choose? The Bottle Selection Guide CGA Connections for Gas Tanks Chemical Reaction Interface Mass Spectrometry (CRIMS)

- Probes
- LiteratureApplication Notes Adsorbent Resins Guide Mass Spec Tips SDS Sheets FAQ MS Calibration Compound Spectra Manuals MS Links/Labs/ Organizations MS Online Tools Flyers on Products/Services Scientific Supplies Catalog About Us NextAdvance Bullet Blender® Homogenizer Protocols Micro-Mesh® Literature Instrumentation Literature Agilent GC/MS Literature SIS News / E-Mail Newsletter NIST MS Database - Update Notifications
- ▶
- HPP7: HP Direct Probe Application NotesNo. 1 - Design of a Direct Exposure Probe and Controller for use on a Hewlett-Packard 5989 Mass Spectrometer No. 2 - A High Temperature Direct Probe for a Mass Spectrometer No. 44 - The Design of a New Direct Probe Inlet for a Mass Spectrometer No. 48 - Demonstration of Sensitivity Levels of Caffeine for a New Direct Probe and Inlet for the HP 5973 MSD No. 49 - Analysis of Cocaine Utilizing a New Direct Insertion Probe on a Hewlett Packard 5973 MSD No. 50 - The Analysis of Multiple Component Drug Samples Using a Direct Probe Interfaced to the HP 5973 MSD
- Application NotesNote 103: EPA Method 325B, Novel Thermal Desorption Instrument Modification to Improve Sensitivity Note 102: Identification of Contaminants in Powdered Beverages by Direct Extraction Thermal Desorption GC/MS Note 101: Identification of Contaminants in Powdered Foods by Direct Extraction Thermal Desorption GC/MS Note 100: Volatile and Semi-Volatile Profile Comparison of Whole Versus Cracked Versus Dry Homogenized Barley Grains by Direct Thermal Extraction Note 99: Volatile and Semi-Volatile Profile Comparison of Whole vs. Dry Homogenized Wheat, Rye and Barley Grains by Direct Thermal Extraction GC/MS Note 98: Flavor and Aroma Profiles of Truffle Oils by Thermal Desorption GC/MS Note 97: Flavor Profiles of Imported and Domestic Beers by Purge & Trap Thermal Desorption GC/MS Note 96: Reducing Warping in Mass Spectrometer Filaments, with SISAlloy® Yttria/Rhenium Filaments Note 95: Detection of Explosives on Clothing Material by Direct and AirSampling Thermal Desorption GC/MS Note 94: Detection of Nepetalactone in the Nepeta Cataria Plant by Thermal Desorption GC/MS Note 93: Detection of Benzene in Carbonated Beverages with Purge & Trap Thermal Desorption GC/MS Note 92: Yttria Coated Mass Spectrometer Filaments Note 91: AutoProbe DEP Probe Tip Temperatures Note 90: An Automated MS Direct Probe for use in an Open Access Environment Note 89: Quantitation of Organics via a Mass Spectrometer Automated Direct Probe Note 88: Analysis of Silicone Contaminants on Electronic Components by Thermal Desorption GC-MS Note 87: Design and Development of an Automated Direct Probe for a Mass Spectrometer Note 86: Simulation of a Unique Cylindrical Quadrupole Mass Analyzer Using SIMION 7.0. Note 85: Replacing an Electron Multiplier in the Agilent (HP) 5973 MSD Note 84: Vacuum Pump Exhaust Filters - Charcoal Exhaust Traps Note 83: Vacuum Pump Exhaust Filters - Oil Mist Eliminators Note 82: Vacuum Pump Exhaust Filters Note 81: Rapid Bacterial Chemotaxonomy By DirectProbe/MSD Note 80: Design, Development and Testing of a Microprocessor ControlledAutomated Short Path Thermal Desorption Apparatus Note 79: Volatile Organic Compounds From Electron Beam Cured and Partially Electron Beam Cured Packaging Using Automated Short Path Thermal Desorption Note 78: A New Solution to Eliminate MS Down-Time With No-Tool-Changing of Analytical GC Columns Note 77: The Determination of Volatile Organic Compounds in VacuumSystem Components Note 76: Determination of the Sensitivity of a CRIMS System Note 75: An Apparatus for Sampling Volatile Organics From LivePlant Material Using Short Path Thermal Desorption Note 74: Examination of Source Design in Electrospray-TOF Using SIMION 3D Note 73: The Analysis of Perfumes and their Effect on Indoor Air Pollution Note 72: 1998 Version of the NIST/EPA/NIH Mass Spectral Library, NIST98 Note 71: Flavor Profile Determination of Rice Samples Using Shor tPath Thermal Desorption GC Methods Note 70: Application of SIMION 6.0 To a Study of the Finkelstein Ion Source: Part II Note 69: Application of SIMION 6.0 To a Study of the Finkelstein Ion Source: Part 1 Note 68: Use of a PC Plug-In UV-Vis Spectrometer To Monitor the Plasma Conditions In GC-CRIMS Note 67: Using Chemical Reaction Interface Mass Spectrometry (CRIMS) To Monitor Bacterial Transport In In Situ Bioremediation Note 66: Probe Tip Design For the Optimization of Direct Insertion Probe Performance Note 65: Determination of Ethylene by Adsorbent Trapping and Thermal Desorption - Gas Chromatography Note 64: Comparison of Various GC/MS Techniques For the Analysis of Black Pepper (Piper Nigrum) Note 63: Determination of Volatile and Semi-Volatile Organics in Printer Toners Using Thermal Desorption GC Techniques Note 62: Analysis of Polymer Samples Using a Direct Insertion Probe and EI Ionization Note 61: Analysis of Sugars Via a New DEP Probe Tip For Use With theDirect Probe On the HP5973 MSD Note 60: Programmable Temperature Ramping of Samples Analyzed ViaDirect Thermal Extraction GC/MS Note 59: Computer Modeling of a TOF Reflectron With Gridless Reflector Using SIMION 3D Note 58: Direct Probe Analysis and Identification of Multicomponent Pharmaceutical Samples via Electron Impact MS Note 57: Aroma Profiles of Lavandula species Note 56: Mass Spec Maintenance & Cleaning Utilizing Micro-Mesh® Abrasive Sheets Note 55: Seasonal Variation in Flower Volatiles Note 54: Identification of Volatile Organic Compounds in Office Products Note 53: SIMION 3D v6.0 Ion Optics Simulation Software Note 52: Computer Modeling of Ion Optics in Time-of-Flight mass Spectrometry Using SIMION 3D Note 51: Development and Characterization of a New Chemical Reaction Interface for the Detection of Nonradioisotopically Labeled Analytes Using Mass Spectrometry (CRIMS) Note 50: The Analysis of Multiple Component Drug Samples Using a Direct Probe Interfaced to the HP 5973 MSD Note 49: Analysis of Cocaine Utilizing a New Direct Insertion Probe on a Hewlett Packard 5973 MSD Note 48: Demonstration of Sensitivity Levels For the Detection of Caffeine Using a New Direct Probe and Inlet for the HP 5973 MSD Note 47: The Application Of SIMION 6.0 To Problems In Time-of-Flight Mass Spectrometry Note 46: Delayed Extraction and Laser Desorption: Time-lag Focusing and Beyond Note 45: Application of SIMION 6.0 to Filament Design for Mass Spectrometer Ionization Sources Note 44: The Design Of a New Direct Probe Inlet For a Mass Spectrometer Note 43: Volatile Organic Composition In Blueberries Note 42: The Influence of Pump Oil Purity on Roughing Pumps Note 41: Hydrocarbon Production in Pine by Direct Thermal Extraction Note 40: Comparison of Septa by Direct Thermal Extraction Note 39: Comparison of Sensitivity Of Headspace GC, Purge and Trap Thermal Desorption and Direct Thermal Extraction Techniques For Volatile Organics Note 38: A New Micro Cryo-Trap For Trapping Of Volatiles At the Front Of a GC Capillary Column Note 37: Volatile Organic Emissions from Automobile Tires Note 36: Identification Of Volatile Organic Compounds In a New Automobile Note 35: Volatile Organics Composition of Cranberries Note 34: Selection Of Thermal Desorption and Cryo-Trap Parameters In the Analysis Of Teas Note 33: Changes in Volatile Organic Composition in Milk Over Time Note 32: Selection and Use of Adsorbent Resins for Purge and Trap Thermal Desorption Applications Note 31: Volatile Organic Composition in Several Cultivars of Peaches Note 30: Comparison Of Cooking Oils By Direct Thermal Extraction and Purge and Trap GC/MS Note 29: Analysis Of Volatile Organics In Oil Base Paints By Automated Headspace Sampling and GC Cryo-Focusing Note 28: Analysis Of Volatile Organics In Latex Paints By Automated Headspace Sampling and GC Cryo-Focusing Note 27: Analysis of Volatile Organics In Soils By Automated Headspace GC Note 26: Volatile Organics Present in Recycled Air Aboard a Commercial Airliner Note 25: Flavor and Aroma in Natural Bee Honey Note 24: Selection of GC Guard Columns For Use With the GC Cryo-Trap Note 23: Frangrance Qualities in Colognes Note 22: Comparison Of Volatile Compounds In Latex Paints Note 21: Detection and Identification Of Volatile and Semi-Volatile Organics In Synthetic Polymers Used In Food and Pharmaceutical Packaging Note 20: Using Direct Thermal Desorption to Assess the Potential Pool of Styrene and 4-Phenylcyclohexene In Latex-Backed Carpets Note 19: A New Programmable Cryo-Cooling/Heating Trap for the Cryo-Focusing of Volatiles and Semi-Volatiles at the Head of GC Capillary Columns Note 18: Determination of Volatile Organic Compounds In Mushrooms Note 17: Identification of Volatile Organics in Wines Over Time Note 16: Analysis of Indoor Air and Sources of Indoor Air Contamination by Thermal Desorption Note 14: Identification of Volatiles and Semi-Volatiles In Carbonated Colas Note 13: Identification and Quantification of Semi-Volatiles In Soil Using Direct Thermal Desorption Note 12: Identification of the Volatile and Semi-Volatile Organics In Chewing Gums By Direct Thermal Desorption Note 11: Flavor/Fragrance Profiles of Instant and Ground Coffees By Short Path Thermal Desorption Note 10: Quantification of Naphthalene In a Contaminated Pharmaceutical Product By Short Path Thermal Desorption Note 9: Methodologies For the Quantification Of Purge and Trap Thermal Desorption and Direct Thermal Desorption Analyses Note 8: Detection of Volatile Organic Compounds In Liquids Utilizing the Short Path Thermal Desorption System Note 7: Chemical Residue Analysis of Pharmaceuticals Using The Short Path Thermal Desorption System Note 6: Direct Thermal Analysis of Plastic Food Wraps Using the Short Path Thermal Desorption System Note 5: Direct Thermal Analysis Using the Short Path Thermal Desorption System Note 4: Direct Analysis of Spices and Coffee Note 3: Indoor Air Pollution Note 2: Detection of Arson Accelerants Using Dynamic Headspace with Tenax® Cartridges Thermal Desorption and Cryofocusing Note 1: Determination of Off-Odors and Other Volatile Organics In Food Packaging Films By Direct Thermal Analysis-GC-MS Tech No. "A" Note 14: Elimination of "Memory" Peaks in Thermal Desorption Improving Sensitivity in the H.P. 5971 MSD and Other Mass Spectrometers - Part I of II Improving Sensitivity in the H.P. 5971 MSD and Other Mass Spectrometers- Part II of II Adsorbent Resins Guide Development and Field Tests of an Automated Pyrolysis Insert for Gas Chromatography. Hydrocarbon Production in Pine by Direct Thermal Extraction A New Micro Cryo-Trap for the Trapping of Volatiles at the Front of a GC Capillary (019P) - Comparison of Septa by Direct Thermal Extraction Volatile Organic Composition in Blueberry Identification of Volatile Organic Compounds in Office Products Detection and Indentification of Volatiles in Oil Base Paintsby Headspace GC with On Column Cryo-Trapping Evaluation of Septa Using a Direct Thermal Extraction Technique INFLUENCE OF STORAGE ON BLUEBERRY VOLATILES Selection of Thermal Desorption and Cryo-Trap Parameters in the Analysis of Teas Redesign and Performance of a Diffusion Based Solvent Removal Interface for LC/MS The Design of a New Direct Probe Inlet for a Mass Spectrometer Analytes Using Mass Spectrometry (CRIMS) Application of SIMION 6.0 to Filament Design for Mass Spectrometer Ionization Sources A Student Guide for SIMION Modeling Software Application of SIMION 6.0 to Problems in Time-of-flight Mass Spectrometry Comparison of Sensitivity of Headspace GC, Purge and TrapThermal Desorption and Direct Thermal Extraction Techniques forVolatile Organics The Influence of Pump Oil Purity on Roughing Pumps Analysis of Motor Oils Using Thermal Desorption-Gas Chromatography-Mass Spectrometry IDENTIFICATION OF VOLATILE ORGANIC COMPOUNDS IN PAPER PRODUCTS Computer Modeling of Ion Optics in Time-of-Flight mass Spectrometry using SIMION 3D Seasonal Variation in Flower Volatiles Development of and Automated Microprocessor Controlled Gas chromatograph Fraction Collector / Olfactometer Delayed Extraction and Laser Desorption: Time-lag Focusing and Beyond A New Micro Cryo-Trap for the Trapping of Volatiles at the Front of a GC Column Design of a Microprocessor Controlled Short Path Thermal Desorption Autosampler Computer Modeling of Ion Optics in Time-of-Flight Mass Spectrometry Using SIMION 3D Thermal Desorption Instrumentation for Characterization of Odors and Flavors
- ▶
- No. 50 - The Analysis of Multiple Component Drug Samples Using a Direct Probe Interfaced to the HP 5973 MSD (This Page)

1999
INTRODUCTION
Direct probe sample introduction to a mass spectrometer has been widely used to analyze single component samples or samples with one or two major analytes. In the past, multiple component samples were difficult if not impossible to interpret using the direct probe sample introduction when the mass spectrometer is used in the electron impact (EI) mode. The forensic community has widely used the mass spectrometer direct probe sample introduction with the mass spectrometer operating in the chemical ionization (CI) mode (1-5). The CI technique produces simplified mass spectra to one or two ions for each analyte, permitting the interpretation of samples with up to 10 analytes present in a single sample. However, the CI technique is not a definitive identification method and the absolute identification of drug samples must be determined via other analytical techniques. To obtain a positive identification of a drug sample, the mass spec should be operated in the EI mode. This has previously not been possible with multiple component samples using the direct probe introduction technique.
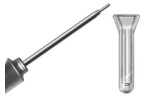
Figure # 1 - HP Probe and Probe Inlet System
It is now possible to analyze multiple component samples via the direct probe using the new high sensitivity Hewlett Packard 5973 MSD interfaced with the SIS Direct Probe sample introduction system. This can be accomplished in the EI mode with the use of the H.P. ChemStation Software that is normally used for GC analysis. This software permits the user to analyze multiple components in a sample analyzed via the direct probe mass spectra run by performing the following refinement of the mass spectral data:
1. Analyze the data using the selected ion extraction module to determine the mass spec scans with the highest concentration of the analytes of interest.
2. Analyze the data by averaging multiple mass spec scans across the area of the greatest ion intensity for the analyte of interest.
3. Permit background subtraction from either the front or back side of the data analyzed in step 2 above. This cleans up the mass spectra by removing interferences and background peaks from the sample mass spectra.
The purpose of this paper is to demonstrate the analysis of a multiple component drug sample using the SIS heated direct probe interfaced to the Hewlett Packard 5973 MSD. An over the counter antihistamine preparation containing Phenylpropanolamine, Brompheniramine Maleate and a variety of other binding materials and diluents was used for this analysis. The heated direct probe will permit the thermal separation of the various analytes in the sample which can then be positively identified from the mass spectral data.
Experimental
The SIS Direct Probe Inlet and Probe (Figure 1) was attached to the GC/MS interface port on a H.P. 5973 MSD. The mass spec probe was heated ballistically to 450 degrees C at a ramp rate in excess of 500 degrees per minute. The probe can also be temperature programmed for slower heating applications. The probe uses flared glass sample vials 1.7mm diameter by 12.75 mm long into which the sample is inserted. The sample vial is then inserted into the tip of the probe where it is held in place by a small spring.
Each 600 mg tablet contains the following major active ingredients.
Brompheniramine maleate: 12 mg
Phenylpropanolamine: 75 mgThe remainder of the tablet consists of acacia, acetylated monoglycerides, calcium sulfate, carnauba wax, citric acid, edible ink. FD&C Blue 1, Gelatin, hydrogenated castor oil, magnesium stearate, magnesium trisilicate, pharmaceutical glaze, polysorbates, povidone, silicon dioxide, steraryl alcohol, sucrose, titanium dioxide, white wax and wheat flour.
The sample was prepared by breaking the tablet and weighing 11.4 milligrams of the tablet into a flask containing 10 ml of chloroform plus 10 ml of 1.0 Normal NaOH. The mixture was thoroughly shaken to dissolve the drug powder and extract the basic drugs into the chloroform solution. Calculations were performed to determine the amount of drugs present in the chloroform solution assuming 100% extraction into the chloroform solution. This chloroform solution should therefore contain a maximum concentration of the two active ingredients as follows:
Phenylpropanolamine 140 ng/ul
Brompheniramine 23 ng/ulTwo (2.0) ul of the extracted chloroform solution was injected into a direct probe sample vial and the solvent was allowed to evaporate to dryness. This was accomplished in about 15 minutes by heating the sample vial in a sample vial block to 60 degrees C.
The HP 5973 MSD was operated in the EI mode and was scanned from mass 40 to 350 daltons at 1 scan per second. The mass spec source temperature was set to 250 and the quads to 150 degrees C. The sample was then inserted into the mass spec probe and inserted through the vacuum lock system of the probe inlet into the mass spec source of the HP 5973 MSD. The sample was then heated ballistically to 300 degrees, and the mass spec was scanned continuously to analyzed the thermally extracted analytes. The total analysis time was 1.0 minute.
After the sample analysis was complete, the total ion chromatogram was viewed using the ChemStation data analysis software and the sample was then further analyzed using the selected ion extraction function of the Chem Station software searching for the 44 ion which is the base ion for phenylpropanolamine and the 249 ion which is the base ion for bromopheniramine. Additional mass ions were evaluated to determine the presence of other analytes as well as interfering compounds in the sample.
Results
Figure # 2 - Direct Probe Analysis of Drug Mixture
The total ion chromatogram for the 1.0 minute probe analysis time is shown in Figure 2A. It consists of one major peak at 0.5 minutes and several other small humps in the total ion chromatogram. The resulting chromatogram can be equated to a packed GC column run with poor resolution. However, with the software tools available in the ChemStation software, a great deal of information can be extracted from this data. The data was first analyzed by extracting the major ion for Phenylpropanol-amine (mass 44) and the major ion for Brompheniramine (249) using the selected ion extraction method in the ChemStation data analysis package. This produced the two chromatograms shown in Figure 2C and Figure 2E. In addition, the small peak at 0.24 minutes was determined to consist of a major ion at mass 281 which was analyzed via the selected ion extraction method and displayed in Figure 2B. When the mass spectrum for the Brompheniramine peak (Figure 2E) was analyzed, it was found to contain a great deal of extraneous ions including 69, 83 and 97. These were assumed to be from an interfering compound which was thermally extracted at the same time interval as the Brompheniramine. Therefore, the selected ion extraction for the 97 ion was determined and is displayed in Figure # 2D.
Figure # 3 - Mass Spectra of Drug Mixture
In Figure 3 are displayed the mass spectra of each of the four selected ion peaks determined in Figure 2. The first spectra (Figure 3B) is the unknown peak at about 2.4 minutes which contains a major ion at 281. This spectra was obtained by averaging the spectra over the time interval 0.233 to 0.240 minutes and subtracting the background spectra at 0.20 minutes. A library search of the Wiley mass spec data base identified this peak as octamethylcyclotetrasiloxane (a common silicone).
The second spectra (Figure 3C) was obtained by averaging the mass spectra in the time interval 0.374 to 0.378 minutes and subtracting the background spectra a 0.26 minutes. It contained a major ion at mass 44 and minor ions at 51, 77, 79 and 91 which are identical to the spectra peaks in Phenylpropanolamine.
The selected ion chromatograms displayed in Figures 2D and 2E were used to obtain a clean mass spectra of the Brompheniramine. As can be seen from Figure 2E, the Brompheniramine is eluted slightly before the larger interfering peak shown in Figure 2D. Therefore, by averaging the spectra over the time interval 0.471 to 0.500 and subtracting the background at 0.56 minutes, the mass spectrum shown in Figure 3E was obtained. The spectra is clean of background peaks and contains two major ions of equal intensity at 247 and 249 (indicating the presence of a Bromide ion). The additional minor ions at masses 42, 44, 58, 72, 115, 167 and 180 confirm the identification of Brompheniramine. Without the background subtraction capabilities of the ChemStation software, the clean mass spectra of this analyte would have been impossible.
The final mass spectrum shown in Figure 3D is the interfering compound. It was obtained by averaging the mass spectra over the time range 0.534 to 0.537 minutes and subtracting the background due to the Brompheniramine at 0.50 minutes. The mass spectrum consists of major ions at 55, 69, 83, 97, and 111and minor peaks at 252, 224, 196 and many others. This compound was identified as 1-octadecanol by the Wiley NBS Library..
The above data analysis demonstrates the use of the selected ion extraction and background subtraction software functions in the ChemStation software to analyze multiple analytes in a drug sample. At least 4 separate analytes were resolved and the mass spectra of each obtained for positive identification. This sample was analyzed in only 1.0 minute.
Conclusion
The analysis of multiple analyte mixtures of pharmaceutical or forensic drug samples can be readily analyzed using the HP 5973 MSD in the EI mode with sample introduction via a heated direct probe. This analysis can be performed in only 1.0 minute. The total ion chromatograph consists of broad and often overlapping peaks for each of the analytes. The Chem Station software functions including selected ion extraction, spectra averaging and background subtraction can all be used to clean up the mass spectra to produce library searchable mass spectra for each of the analytes.
The heated direct probe and sample introduction system has proved to be a useful addition to the new Hewlett Packard 5973 MSD for the analysis of drugs and pharmaceuticals. The probe inlet system permits the direct introduction of the probe through what is normally the GC/MS interface line on the MSD. Samples are normally analyzed in less than 1.5 minutes using the ballistic heating probe method. However, the probe can be temperature programmed at slower rates for the purpose of improving the separation of mixtures of analytes in a single sample. The highly sensitive HP 5973 MSD and the versatile ChemStation software permit the analysis of pure and mixed drug samples via the EI mass spec probe technique to achieve a fast and definitive method of analysis. The direct probe introduction system interfaced to the HP 5973 will be a valuable technique for the analysis of many drug and pharmaceutical samples, where fast sample analysis is required.
References
(1) Identification of Drugs by chemical Ionization Mass Spectroscopy, Part II, Richard Saferstein, Jew Ming Chao and John Manura, J. of Forensic Science, Vol 19, No.3, 1974, pp 463-485.
(2) Identification of Heroin and its Diluents by Chemical Ionization Mass Spectroscopy, Jew Ming Chao, Richard Saferstein and John Manura, Analytical Chemistry, Vol 46, No. 2, Feb. 1974, pp 296 - 298.
(3) Drug Detection in Urine by Chemical Ionization Mass Spectroscopy, Richard Saferstein, John Manura. and P.K. De, J. of Forensic Science, Vol 23, No. 1, 1978, pp 29 - 36.
(4) Drug Detection in Urine by Chemical Ionization Mass Spectroscopy, Part II, Richard Saferstein, John Manura, Thomas Brettell and P.K.De, J. of Analytical Toxicology, Vol. 2, Nov-Dec 1978, pp 245 - 249.
(5) Chemical Ionization Mass Spectrometry of Morphine Derivatives, Richard Saferstein, John Manura and Thomas Brettell, J. of Forensic Science, Vol 24, 1979, pp 312 - 316.