- ▶
- Heaters/Source
- ▶
- Agilent Heaters and SensorsMass Spectrometry, Scientific Supplies & ManufacturingScientific Instrument Services 5973 Source Heater Tamper Resistant Allen Wrench 5973/5975 Quad Sensor 5985 Source Heater Assembly Agilent Interface Heater Assembly 5971 Interface Heater

- ▶
- Probes
- LiteratureApplication Notes Adsorbent Resins Guide Mass Spec Tips SDS Sheets FAQ MS Calibration Compound Spectra Manuals MS Links/Labs/ Organizations MS Online Tools Flyers on Products/Services Scientific Supplies Catalog About Us NextAdvance Bullet Blender® Homogenizer Protocols Micro-Mesh® Literature Instrumentation Literature Agilent GC/MS Literature SIS News / E-Mail Newsletter NIST MS Database - Update Notifications

- ▶
- Application NotesNote 103: EPA Method 325B, Novel Thermal Desorption Instrument Modification to Improve Sensitivity Note 102: Identification of Contaminants in Powdered Beverages by Direct Extraction Thermal Desorption GC/MS Note 101: Identification of Contaminants in Powdered Foods by Direct Extraction Thermal Desorption GC/MS Note 100: Volatile and Semi-Volatile Profile Comparison of Whole Versus Cracked Versus Dry Homogenized Barley Grains by Direct Thermal Extraction Note 99: Volatile and Semi-Volatile Profile Comparison of Whole vs. Dry Homogenized Wheat, Rye and Barley Grains by Direct Thermal Extraction GC/MS Note 98: Flavor and Aroma Profiles of Truffle Oils by Thermal Desorption GC/MS Note 97: Flavor Profiles of Imported and Domestic Beers by Purge & Trap Thermal Desorption GC/MS Note 96: Reducing Warping in Mass Spectrometer Filaments, with SISAlloy® Yttria/Rhenium Filaments Note 95: Detection of Explosives on Clothing Material by Direct and AirSampling Thermal Desorption GC/MS Note 94: Detection of Nepetalactone in the Nepeta Cataria Plant by Thermal Desorption GC/MS Note 93: Detection of Benzene in Carbonated Beverages with Purge & Trap Thermal Desorption GC/MS Note 92: Yttria Coated Mass Spectrometer Filaments Note 91: AutoProbe DEP Probe Tip Temperatures Note 90: An Automated MS Direct Probe for use in an Open Access Environment Note 89: Quantitation of Organics via a Mass Spectrometer Automated Direct Probe Note 88: Analysis of Silicone Contaminants on Electronic Components by Thermal Desorption GC-MS Note 87: Design and Development of an Automated Direct Probe for a Mass Spectrometer Note 86: Simulation of a Unique Cylindrical Quadrupole Mass Analyzer Using SIMION 7.0. Note 85: Replacing an Electron Multiplier in the Agilent (HP) 5973 MSD Note 84: Vacuum Pump Exhaust Filters - Charcoal Exhaust Traps Note 83: Vacuum Pump Exhaust Filters - Oil Mist Eliminators Note 82: Vacuum Pump Exhaust Filters Note 81: Rapid Bacterial Chemotaxonomy By DirectProbe/MSD Note 80: Design, Development and Testing of a Microprocessor ControlledAutomated Short Path Thermal Desorption Apparatus Note 79: Volatile Organic Compounds From Electron Beam Cured and Partially Electron Beam Cured Packaging Using Automated Short Path Thermal Desorption Note 78: A New Solution to Eliminate MS Down-Time With No-Tool-Changing of Analytical GC Columns Note 77: The Determination of Volatile Organic Compounds in VacuumSystem Components Note 76: Determination of the Sensitivity of a CRIMS System Note 75: An Apparatus for Sampling Volatile Organics From LivePlant Material Using Short Path Thermal Desorption Note 74: Examination of Source Design in Electrospray-TOF Using SIMION 3D Note 73: The Analysis of Perfumes and their Effect on Indoor Air Pollution Note 72: 1998 Version of the NIST/EPA/NIH Mass Spectral Library, NIST98 Note 71: Flavor Profile Determination of Rice Samples Using Shor tPath Thermal Desorption GC Methods Note 70: Application of SIMION 6.0 To a Study of the Finkelstein Ion Source: Part II Note 69: Application of SIMION 6.0 To a Study of the Finkelstein Ion Source: Part 1 Note 68: Use of a PC Plug-In UV-Vis Spectrometer To Monitor the Plasma Conditions In GC-CRIMS Note 67: Using Chemical Reaction Interface Mass Spectrometry (CRIMS) To Monitor Bacterial Transport In In Situ Bioremediation Note 66: Probe Tip Design For the Optimization of Direct Insertion Probe Performance Note 65: Determination of Ethylene by Adsorbent Trapping and Thermal Desorption - Gas Chromatography Note 64: Comparison of Various GC/MS Techniques For the Analysis of Black Pepper (Piper Nigrum) Note 63: Determination of Volatile and Semi-Volatile Organics in Printer Toners Using Thermal Desorption GC Techniques Note 62: Analysis of Polymer Samples Using a Direct Insertion Probe and EI Ionization Note 61: Analysis of Sugars Via a New DEP Probe Tip For Use With theDirect Probe On the HP5973 MSD Note 60: Programmable Temperature Ramping of Samples Analyzed ViaDirect Thermal Extraction GC/MS Note 59: Computer Modeling of a TOF Reflectron With Gridless Reflector Using SIMION 3D Note 58: Direct Probe Analysis and Identification of Multicomponent Pharmaceutical Samples via Electron Impact MS Note 57: Aroma Profiles of Lavandula species Note 56: Mass Spec Maintenance & Cleaning Utilizing Micro-Mesh® Abrasive Sheets Note 55: Seasonal Variation in Flower Volatiles Note 54: Identification of Volatile Organic Compounds in Office Products Note 53: SIMION 3D v6.0 Ion Optics Simulation Software Note 52: Computer Modeling of Ion Optics in Time-of-Flight mass Spectrometry Using SIMION 3D Note 51: Development and Characterization of a New Chemical Reaction Interface for the Detection of Nonradioisotopically Labeled Analytes Using Mass Spectrometry (CRIMS) Note 50: The Analysis of Multiple Component Drug Samples Using a Direct Probe Interfaced to the HP 5973 MSD Note 49: Analysis of Cocaine Utilizing a New Direct Insertion Probe on a Hewlett Packard 5973 MSD Note 48: Demonstration of Sensitivity Levels For the Detection of Caffeine Using a New Direct Probe and Inlet for the HP 5973 MSD Note 47: The Application Of SIMION 6.0 To Problems In Time-of-Flight Mass Spectrometry Note 46: Delayed Extraction and Laser Desorption: Time-lag Focusing and Beyond Note 45: Application of SIMION 6.0 to Filament Design for Mass Spectrometer Ionization Sources Note 44: The Design Of a New Direct Probe Inlet For a Mass Spectrometer Note 43: Volatile Organic Composition In Blueberries Note 42: The Influence of Pump Oil Purity on Roughing Pumps Note 41: Hydrocarbon Production in Pine by Direct Thermal Extraction Note 40: Comparison of Septa by Direct Thermal Extraction Note 39: Comparison of Sensitivity Of Headspace GC, Purge and Trap Thermal Desorption and Direct Thermal Extraction Techniques For Volatile Organics Note 38: A New Micro Cryo-Trap For Trapping Of Volatiles At the Front Of a GC Capillary Column Note 37: Volatile Organic Emissions from Automobile Tires Note 36: Identification Of Volatile Organic Compounds In a New Automobile Note 35: Volatile Organics Composition of Cranberries Note 34: Selection Of Thermal Desorption and Cryo-Trap Parameters In the Analysis Of Teas Note 33: Changes in Volatile Organic Composition in Milk Over Time Note 32: Selection and Use of Adsorbent Resins for Purge and Trap Thermal Desorption Applications Note 31: Volatile Organic Composition in Several Cultivars of Peaches Note 30: Comparison Of Cooking Oils By Direct Thermal Extraction and Purge and Trap GC/MS Note 29: Analysis Of Volatile Organics In Oil Base Paints By Automated Headspace Sampling and GC Cryo-Focusing Note 28: Analysis Of Volatile Organics In Latex Paints By Automated Headspace Sampling and GC Cryo-Focusing Note 27: Analysis of Volatile Organics In Soils By Automated Headspace GC Note 26: Volatile Organics Present in Recycled Air Aboard a Commercial Airliner Note 25: Flavor and Aroma in Natural Bee Honey Note 24: Selection of GC Guard Columns For Use With the GC Cryo-Trap Note 23: Frangrance Qualities in Colognes Note 22: Comparison Of Volatile Compounds In Latex Paints Note 21: Detection and Identification Of Volatile and Semi-Volatile Organics In Synthetic Polymers Used In Food and Pharmaceutical Packaging Note 20: Using Direct Thermal Desorption to Assess the Potential Pool of Styrene and 4-Phenylcyclohexene In Latex-Backed Carpets Note 19: A New Programmable Cryo-Cooling/Heating Trap for the Cryo-Focusing of Volatiles and Semi-Volatiles at the Head of GC Capillary Columns Note 18: Determination of Volatile Organic Compounds In Mushrooms Note 17: Identification of Volatile Organics in Wines Over Time Note 16: Analysis of Indoor Air and Sources of Indoor Air Contamination by Thermal Desorption Note 14: Identification of Volatiles and Semi-Volatiles In Carbonated Colas Note 13: Identification and Quantification of Semi-Volatiles In Soil Using Direct Thermal Desorption Note 12: Identification of the Volatile and Semi-Volatile Organics In Chewing Gums By Direct Thermal Desorption Note 11: Flavor/Fragrance Profiles of Instant and Ground Coffees By Short Path Thermal Desorption Note 10: Quantification of Naphthalene In a Contaminated Pharmaceutical Product By Short Path Thermal Desorption Note 9: Methodologies For the Quantification Of Purge and Trap Thermal Desorption and Direct Thermal Desorption Analyses Note 8: Detection of Volatile Organic Compounds In Liquids Utilizing the Short Path Thermal Desorption System Note 7: Chemical Residue Analysis of Pharmaceuticals Using The Short Path Thermal Desorption System Note 6: Direct Thermal Analysis of Plastic Food Wraps Using the Short Path Thermal Desorption System Note 5: Direct Thermal Analysis Using the Short Path Thermal Desorption System Note 4: Direct Analysis of Spices and Coffee Note 3: Indoor Air Pollution Note 2: Detection of Arson Accelerants Using Dynamic Headspace with Tenax® Cartridges Thermal Desorption and Cryofocusing Note 1: Determination of Off-Odors and Other Volatile Organics In Food Packaging Films By Direct Thermal Analysis-GC-MS Tech No. "A" Note 14: Elimination of "Memory" Peaks in Thermal Desorption Improving Sensitivity in the H.P. 5971 MSD and Other Mass Spectrometers - Part I of II Improving Sensitivity in the H.P. 5971 MSD and Other Mass Spectrometers- Part II of II Adsorbent Resins Guide Development and Field Tests of an Automated Pyrolysis Insert for Gas Chromatography. Hydrocarbon Production in Pine by Direct Thermal Extraction A New Micro Cryo-Trap for the Trapping of Volatiles at the Front of a GC Capillary (019P) - Comparison of Septa by Direct Thermal Extraction Volatile Organic Composition in Blueberry Identification of Volatile Organic Compounds in Office Products Detection and Indentification of Volatiles in Oil Base Paintsby Headspace GC with On Column Cryo-Trapping Evaluation of Septa Using a Direct Thermal Extraction Technique INFLUENCE OF STORAGE ON BLUEBERRY VOLATILES Selection of Thermal Desorption and Cryo-Trap Parameters in the Analysis of Teas Redesign and Performance of a Diffusion Based Solvent Removal Interface for LC/MS The Design of a New Direct Probe Inlet for a Mass Spectrometer Analytes Using Mass Spectrometry (CRIMS) Application of SIMION 6.0 to Filament Design for Mass Spectrometer Ionization Sources A Student Guide for SIMION Modeling Software Application of SIMION 6.0 to Problems in Time-of-flight Mass Spectrometry Comparison of Sensitivity of Headspace GC, Purge and TrapThermal Desorption and Direct Thermal Extraction Techniques forVolatile Organics The Influence of Pump Oil Purity on Roughing Pumps Analysis of Motor Oils Using Thermal Desorption-Gas Chromatography-Mass Spectrometry IDENTIFICATION OF VOLATILE ORGANIC COMPOUNDS IN PAPER PRODUCTS Computer Modeling of Ion Optics in Time-of-Flight mass Spectrometry using SIMION 3D Seasonal Variation in Flower Volatiles Development of and Automated Microprocessor Controlled Gas chromatograph Fraction Collector / Olfactometer Delayed Extraction and Laser Desorption: Time-lag Focusing and Beyond A New Micro Cryo-Trap for the Trapping of Volatiles at the Front of a GC Column Design of a Microprocessor Controlled Short Path Thermal Desorption Autosampler Computer Modeling of Ion Optics in Time-of-Flight Mass Spectrometry Using SIMION 3D Thermal Desorption Instrumentation for Characterization of Odors and Flavors
- ▶
- Note 87: Design and Development of an Automated Direct Probe for a Mass Spectrometer (This Page)

Article by: John J. Manura and David J.
Manura
AutoProbe Design and Development by: John Manos, John Miller, John
Manura, Christopher Baker, Dan Lieske, Roland Roadenbaugh. Software
Design by: David J. Manura
Scientific Instrument
Services, Ringoes, NJ
9/12/00
Introduction:
The direct probe was one of the earliest techniques used to introduce samples into a mass spectrometer. The technique is still popular today because it provides a means to perform rapid sample analysis with minimal or no sample preparation. The electron impact (EI) mass spectrometer mode of operation can be used when the sample to be analyzed is relatively pure or when chromatographic separation of a mixture is not required. Direct probe analysis has also been widely used with Chemical Ionization (CI) mass spectrometry. The simplicity of the CI spectrum permits the analysis of mixtures, whose spectra are difficult to interpret using the EI mode of operation.Applications of the direct probe technique include the screening of drug and pharmaceutical samples, quality control sample analysis, spot analysis of chemical reaction mixtures to monitor rates of synthesis, and the analysis of compounds which cannot be chromatographed. However the technique has been limited in the past by several disadvantages. The technique was not reproducible or quantitative. The direct probe was normally operated by trained mass spectrometer users, and it did not lend itself for use in an open access environment.
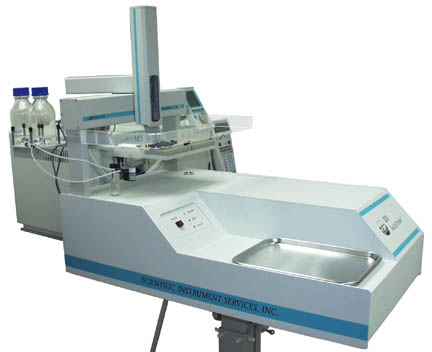
Figure 1 - AutoProbe mounted on the Finnigan Trace™
MS from ThermoQuest
This study describes the design of a new automated direct exposure MS probe
(DEP) that addresses the previously mentioned limitations of older manual
probes. The DEP probe uses a platinum filament wire for the analysis of
samples. Samples to be analyzed are dissolved in a suitable solvent and are
then injected onto the DEP filament wire using an automated syringe
injector. After injection, the sample solvent is evaporated from the wire
using a small current. The sample is introduced through a vacuum isolation
valve and into the mass spectrometer (MS). Once inside the MS, a current is
applied through the DEP filament to desorb the sample into the MS source
for analysis. After analysis, the DEP tip is withdrawn from the MS source,
heated to high temperature to clean the DEP filament, and then uninjected
through the isolation valve so that it is ready for the next sample
injection. The system is completely automated and computer controlled. The
software to control the automated probe is fully integrated into the mass
spectrometer software to provide for a seamless probe-mass spectrometer
operation package. The result of this design was an automated MS direct
probe that can analyze samples quantitatively at a rate of 2 to 5 minutes
per sample. In addition the technique has proven to be easily used in an
Open Access environment. The automated direct probe system developed was
named the AutoProbe™.
Development of the Probe and Probe Tip
The development of the automated direct probe began with the design of the
direct probe and probe tip. The DEP style of probe tip was selected because
it permits samples to be loaded via an automated syringe injection system.
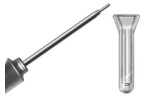
A replaceable plug-in style probe tip was designed to plug into the end of
the probe shaft. The replaceable probe tip consists of a metal filament
base with two electrical connector pins and four small coils of 0.005"
diameter platinum wire for the filament. The probe shaft consists of a
stainless steel ground shaft through which passes the two electrical leads
for the filament.
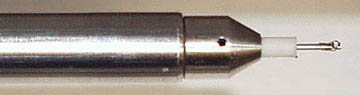
Figure 2 - DEP Probe with plug in filament
The DEP filament was tested on a Hewlett-Packard MS Engine to determine its
normal operating conditions. There is no thermocouple or other temperature
sensor to determine the temperature of the filament wire. However the HP
Engine has a sight glass over the MS source which permits the DEP filament
to be viewed while it is heated. The temperature of the filament is
controlled by the current through the filament. The filament current was
adjusted by a microprocessor controlled current supply that can regulate
the current through the filament between 1 mA to 3000 mA (3.0A). Testing
determined that the filament begins to glow red at 900 milliamps, glows
bright yellow at 1.2 amps and burns out at 1.6 amps. Three separate current
ramps are used for the operation of the DEP probe, each of which requires a
different filament current. Normal operating conditions for the probe were
selected as follows:
| Step | Filament Current Range | Estimated Temperature |
| Solvent Removal | 5 mA to 20 mA | 60 to 100 degrees C |
| Sample Analysis | 10 mA to 1000 mA | 100 to 1000 degrees C |
| Bakeout | 500 mA to 1200 mA | 500 to 1500 degrees C |
The probe was mounted on a servo-controlled linear
actuator with a 50 cm stroke length, which provides for probe movement. The
servo controller permits the probe to stop at the various set positions
required for the analysis, including the sample load position and various
positions inside the isolation valve and MS.
Vacuum Isolation Valve
The heart of the AutoProbe is the isolation valve (Fig. 3 and 4). The
purpose of the isolation valve is to permit the probe tip, which is at
atmospheric pressure, to be injected into the mass spectrometer vacuum
system while still maintaining a good vacuum in the mass spectrometer. To
accomplish this, the direct probe is first inserted into the first probe
seal of the isolation valve. An electrically operated solenoid valve opens
to permit the accessory vacuum pump to evacuate the area in the isolation
valve between the probe tip and the ball valve. A vacuum gauge with
pressure readout measures this vacuum. When the pressure gets down below
200 millitorr, the probe is advanced to the second seal in the isolation
valve assembly. Lastly, the pneumatically controlled ball valve opens,
which allows the probe to be inserted into the mass spectrometer.
Figure 3 - Probe positioned at the first seal in
the isolation valve - Figure 4 - Probe passing through the
rotary ball valve
Sample Loader
A CTC PAL Autosampler was selected as the automated syringe injection
system to load samples onto the DEP wire. This PAL Autosampler is mounted
on top of the probe and aligned so that the syringe would accurately inject
samples onto the DEP wire. When injected, the tip of the syringe is within
0.002" to 0.010" from the DEP filament wire. This distance permits the
samples to be injected onto the DEP wire without physically touching the
fragile filament coil. This distance is also optimal for loading samples
onto the DEP wire coil. As a result, the DEP filament is expected to have a
long life, physical shape will not vary, and samples can be accurately and
reproducibly injected onto the filament wire. This point later proved to be
the reason this technique was reproducible and quantitative.

Figure 5 CTC PAL Autosampler on the
AutoProbe
AutoProbe Console
The AutoProbe console (Fig. 6) was designed to attach to the MS and to
contain the AutoProbe components, including a microprocessor, the direct
probe and linear actuator, a filament current controller, the isolation
valve and components, the PAL Autosampler power supply, a vacuum gauge, and
a number of valves and relays. A Z-World microprocessor is used to control
the operation of the AutoProbe. There is PC software to integrate the MS
software to the microprocessor in the AutoProbe console.
Figure 6 - Schematic of the AutoProbe Console
AutoProbe System Components
- linear Thrust column
- Probe Rod
- DEP Probe Tip
- MS Probe Interface
- Isolation Valve Assembly
- Electronic Vacuum Gauge Pressure Sensor
- Isolation Valve Relay Switches
- Filament Current Controller
- Relay
- CTC Power Supply
- AutoProbe Microprocessor Controller
- Servo Controller for Linear Thrust Column
- Electronic Manifold
- Autosampler Syringe
- CTC PAL column
AutoProbe Software and PC Control
The AutoProbe System has four levels of software that control its entire
operation. SIS developed software for the first three levels. The four
levels include:
(1) Embedded Software - This resides on the embedded C-programmable
microprocessor controller inside the AutoProbe instrument. It directly
controls the various hardware components of the AutoProbe, including the
servo controller for the linear actuator, the DEP filament current
controller, the isolation and rough-pump valves, the vacuum gauge sensor,
and the pneumatic valves for the ball valve.
Figure 7 - ThermoQuest Xcalibur™
screen with AutoProbe system setup
(2) PC-based Instrument Control Software - This controls the AutoProbe
instrument from the PC. It does this by communicating with the embedded
software (1) via a serial communications link. The PC software sends
commands (such as sample run requests) to the embedded software and reads
back status data such as the filament current, vacuum readings, the probe
position, and operating states. C++, wxWindows, and COM technologies were
used. CTC developed their own software for controlling the autosampler. In
a typical operation, this layer of software is transparent to the user.
(3) Virtual Instrument Modules - Each instrument of the AutoProbe System is
associated with a plug-in module called an "Xcalibur virtual instrument
(VI)." These virtual instruments allow instrument vendors to integrate
their own instrument control software (2) into the ThermoQuest Xcalibur
software package (4). Virtual instruments can be thought of as (software)
abstractions of instrument hardware. They conform to various standards such
as how instruments are configured, methods are set up, and instrument
operations are synchronized. Therefore, the entire AutoProbe system is
seamlessly integrated into Xcalibur according to the Xcalibur instrument
model. SIS developed a VI for the AutoProbe, while CTC and ThermoQuest
provide the autosampler and MS VI's respectively.
(4) System Control and Analysis Software -ThermoQuest's Xcalibur software
integrates the setup and operation of the virtual instruments (3). It
provides a uniform interface for setting up methods and sequences, running
samples, collecting data, doing library searches, analyzing results, and
printing reports. It also provides an Open Access mode of operation.
As a result of this software integration, the AutoProbe is seamlessly
integrated into the Xcalibur software package. The AutoProbe is controlled
within the Xcalibur screens and the AutoProbe system status is shown in the
Xcalibur system screens.
The AutoProbe System
All the components of the AutoProbe™
were assembled into the AutoProbe Console and attached to a Finnigan Trace™
MS system from ThermoQuest. Cables were attached to the AutoProbe console
to integrate all the systems together. A serial communications cable
connects the AutoProbe to the PC. A second serial communications cable
connects the CTC PAL Autosampler to the PC. An IO cable connects the CTC
PAL Autosampler to the AutoProbe for syncronizing the operation of these
two systems. A remote start cable connects the AutoProbe to the MS. This
cable enables the AutoProbe system to start the MS after the sample has
been injected.
The standard sequence of operation of the AutoProbe system is as
follows.
1. Samples are prepared in solution in a concentration range between 5
ng/ul and 1000 ng/ul.
2. The operator sets up a sequence of samples, methods, and processing
actions in Xcalibur and starts a run.
3. The Xcalibur software signals the AutoProbe, CTC PAL Autosampler, and MS
to prepare for an analysis.
4. The DEP probe moves to the load position.
5. Xcalibur signals the CTC PAL Autosampler to begin a sample run by
loading a selected sample.
6. Between 0.125 ul and 1.0 ul of sample are injected onto the DEP filament
wire.
7. After the sample is injected onto the DEP filament, the solvent is
evaporated from the sample in air. (Alternately, the solvent may be
evaporated later inside the vacuum or not at all.)
8. The probe moves to the first vacuum seal, and the electric solenoid
valve opens to evacuate the probe inlet.
9. After the vacuum reaches 200 millitorr (adjustable), the probe moves to
the second vacuum seal, and the pneumatically controlled ball valve opens.
(If a leak occurs, the sequence is paused, the AutoProbe resets itself, and
an error is recorded on the log window.)
10. The probe moves to its final position against the MS source. The MS is
signaled to begin scanning just before this position is reached.
11. The Xcalibur software downloads the DEP filament current values to the
AutoProbe controller and the filament begins its temperature ramp. (The
AutoProbe can do up to three filament ramps.)
12. The MS stops scanning and collecting data once the filament ramps are
complete.
13. The probe moves away from the MS source about 1" and does an optional
filament bakeout to clean the DEP wire and prepare for the next sample.
14. After bakeout, the probe moves to the second seal in the isolation
valve, the pneumatic ball valve closes, and the electric solenoid
closes.
15. The probe returns to its home position and waits for the signal for the
next sample.
Sample Analysis
Samples of caffeine (MW = 194) and Cholestane (MW = 372 ) were prepared to
conduct a number of studies on the automated DEP technique. Several
parameters such as sensitivity, reproducibility, cross contamination,
memory effects, and quantitation were studied. At the same time the
AutoProbe system was evaluated to determine any operational problems, bugs
in the software, life of the DEP filament and the life and reliability of
the probe seals and other system component problems. The testing on the
system was designed to be exhaustive with more than 2800 samples analyzed
over a 2 week time period. During one three day period the AutoProbe was
operated continuously and about 1500 samples were analyzed with no
interruption.
Caffeine samples were prepared in methanol in concentrations varying from
600 ng/ul down to 1 ng/ul by successive dilutions. In a likewise manner,
Cholestane samples were prepared in chloroform in concentrations from 1000
ng/ul down to 1 ng/ul for additional studies. Injection volumes varied from
0.125 ul to 1.0 ul for the various studies.
For these studies, 0.5 ul of each of the prepared samples was injected onto
the DEP wire. The AutoProbe DEP filament was heated ballistically for most
of the samples to obtain total ion chromatograms in the shortest amount of
time and therefore produce the greatest sensitivity of analysis. The DEP
filament was heated with 900 mA of current for 30 seconds during analysis
and subsequently baked out at 900 mA for 15 seconds in the bakeout cleaning
step. The total analysis time for each sample was 3.0 minutes.
Additional studies were conducted by heating the DEP filament with a
programmed ramp from 0 to 900 mA at a ramp rate of 50 mA per second to
study the effect of a slower temperature ramp on the total ion chromatogram
peak shape and sensitivity.
The AutoProbe was attached to the ThermoQuest Trace MS. The mass
spectrometer was operated in the EI mode (70 eV) and operated in the total
ion scan mode. The mass spectrometer scanned from mass 100 to 400 at a rate
of 2 to 3 scans per second.
Sensitivity
Direct probe techniques are known to be less sensitive than GC techniques.
This is due to the fact that the resulting peaks in the total ion
chromatograph from the probe samples are much wider and therefore less
intense than a GC capillary peak.
To determine sensitivity of the AutoProbe DEP technique, a series of
dilutions of caffeine in methanol were prepared from 600 ng/ul down to 1
ng/ul. At a concentration of 10 ng injected, the total ion chromatogram
exhibits a distinct peak for the caffeine of at least 10 times the
background. The mass spectrum of caffeine is clearly detected and a library
search identifies it as caffeine. The caffeine 194 peak was clearly
detectable in the subsequent analysis down to 2 ng but the caffeine peak in
the total ion chromatogram was only about 2 times the background at this
concentration. These detection limits were extended 10 to 100 fold when the
samples were analyzed in the single ion monitoring mode (SIM).
Figure 8 - Detection of Caffeine at 10 ng level in total ion MS
scan.
When the alkaloid drug Ibuprofen was analyzed in a similar manner in a total ion scan, the drug was easily detected down to 0.4 nanogram. The top chart below shows the total ion chromatogram. The lower two charts are the extractions ions for the major ions in ibuprofen at masses 206 and 358.
Figure 8 B - Detection of Ibuprofen at 0.4 ng level in total ion MS scan.
When the same ibuprofen sample was analyzed in the SIM mode for the ions 206 and 358, the sensitivity of the technique was increased to less than 0.1 nanogram as shown below.
Figure 8 C - Detection of Iboprofen at 0.1 ng level in
SIM MS scan.
Reproducibility
Historically the direct probe techniques are not known for their
reproducibility. This is because it is quite difficult to accurately and
reproducibily apply a sample to a DEP probe tip multiple times. In addition
the DEP wire is often touched, distorted or the coils shorted out when
samples are injected onto the DEP filament wire. Changing the geometry of
the DEP filament coil, changes its heating patterns and therefore minimizes
reproducibility. The AutoProbe eliminates these problems.
Figure 9 Reproducibility of the DEP Technique
To determine reproducibility of the AutoProbe technique, a sample of
Cholestane at a concentration of 125 ng/ul was prepared. Then 0.5 ul of
this sample (62.5 ng) was repeatedly injected onto the DEP wire. This was
repeated 158 times. The mass spec was scanned over the mass range of 100 to
450 and the total ion signal was collected. The sample was analyzed by
selecting the 217 ion of cholestane and integrating the area of this ion in
the total ion chromatogram. The peak area at mass 217 for each sample of
the 158 samples was plotted in the chart below. The reproducibility of peak
areas for all the samples was within 10% of each other. This study proves
that the AutoProbe DEP technique is very reproducible. This data also
suggested that the automated DEP technique might be quantitative, and this
was tested below.
Memory, Background and "Cross Contamination"
One of the major concerns about any MS sample introduction technique are
"memory effects" and "cross contamination" of samples. A technique is of
little use if "cross contamination" of subsequent samples occurs.
To test for the effect of "memory effects" for the DEP technique, a series
of Cholestane samples was prepared in chloroform at a concentration of 500
ng/ul. An injection of 0.5 ul of this sample (total 250 ng of Cholestane)
was injected onto the DEP probe tip and analyzed as described previously.
This analysis was completed 5 consecutive times within a 15 minute time
span (3 minutes per sample) with no blanks between samples. After each
sample run, the DEP wire was baked out at 900 mA for 15 seconds. This
bakeout step occurs when the DEP filament is about 1.0 inches from the mass
spec source. It's purpose is to clean the DEP filament wire to eliminate
any residues of the previous sample and prepare the DEP filament for the
next sample.
After the fifth Cholestane sample was analyzed, a blank injection of 0.5 ul
of clean methanol was injected onto the DEP probe tip. The results are
shown in the two total ion chromatograms below. Both plots are at the same
intensity scale. The Cholestane sample produced a strong, almost
overloaded, total ion chromatogram. The blank sample produced a flat
baseline indicating no carryover from the previous samples.
Figure 10 - Background check after running 5 consecutive strong
samples.
The second chart below shows the mass spec data at 0.18 minutes for the 250
ng of Cholestane and the blank methanol sample from the data in the total
ion chromatograms above. The scale on the blank sample is at 1000 times the
scale expansion of the 250 ng of Cholestane sample mass spectrum. No peaks
were detected in the blank sample which could be attributed to the
Cholestane. This study was repeated several times at concentrations of
Cholestane and Caffeine between 500 ng and 1 ng with identical
results.
Figure 11 - Background mass spec after running 5 consecutive strong
samples
The results above prove that the DEP technique does not suffer from "memory
effect" or "cross contamination" problems. The high temperature cleaning
step removes all traces of any of the previous samples. It is recommended
that the high temperature cleaning step be used in all analyses. The
running of a blank sample between analyses is optional and is not normally
required.
Quantitation
Direct probe techniques have not been known to be quantitative. The DEP
technique has never been shown to be reproducible enough to accomplish this
for the reasons stated above. However our studies on reproducibility above
show that the AutoProbe DEP technique is very reproducible. As a result the
following studies were performed to show that this technique is indeed
quantitative.
A series of dilutions of Cholestane were prepared at concentrations from
1000 ng/ul down to 1 ng/ul . Again 0.5 ul of each sample was injected onto
the DEP filament and the samples analyzed with the AutoProbe DEP technique
as described previously. Each of the dilutions was analyzed 5 times to not
only determine if the automated DEP technique was quantitative but to once
again show its reproducibility. At the end of each sample analysis the DEP
filament was baked out in vacuum at 900 mA for 15 seconds to clean the DEP
wire and prepare for the next sample. After each set of 5 samples a blank
methanol sample was run. All samples were run in the EI mode and in full MS
scan mode.
A plot of the results is shown below. The repeated runs at the same
concentration form a tight cluster, again demonstrating the reproducibility
and accuracy of the DEP technique. The quantitation plot below is linear
over about 2 orders of sensitivity (from 1000 ng down to 10 ng). The
linearity of the plot does falloff at low levels of sensitivity (< 10
ng).
Figure 11 - Calibration Curve for the Quantitation of
Cholestane
The results proved that the automated DEP techniques is not only
reproducible, but it is quantitative. Quantitation with a direct probe to
our knowledge has not been achieved in the past. This reproducibility and
quantitation capability is due to the automation of the system with the
exact same conditions being applied to each sample and to the unchanging
geometry of the DEP filament. Since the filament coil is never touched or
moved, the sample is injected onto the DEP filament coil in exactly the
same point for every sample. This opens up many new applications of the DEP
technique for the fast quantitation of analytes.
For additional information of quantitation utilizing the AutoProbe
technique, see the next application note on the AutoProbe.
Open Access Operation
One of the unique features of the ThermoQuest Xcalibur™
software is the ability to operate the mass spectrometer in an Open Access
Mode. The Open Access System permits inexperienced chemists and technicians
to submit samples directly to the mass spectrometer for analysis. The
samples are then analyzed automatically and the results reported back to
the chemist with little or no interaction of the mass spectrometer
operator. The results are increased productivity from the mass spectrometer
lab with less technical staff requirements.
The AutoProbe was integrated into this Open Access mode of operation within
the Xcalibur™
software system. For a sample to be analyzed, the chemist fills out a
simple form on a PC screen including the submitters name and sample name.
He then selects a method of analysis from one of several standard methods
preestablished by the supervisor. After completing the form, the user is
instructed where to place his sample. The samples are then analyzed
automatically with no operator intervention. The chemist has the option of
having the results e-mailed back to him.
Figure 12 - Open Access Screen in Xcalibur for the submission of samples
for AutoProbe analysis
Filament Life
When a DEP probe tip is used in the manual mode of operation, filament life
is limited to usually between 10 and 25 analysis. This limited life is not
normally due to the burning out of the DEP filament, but to the physical
destruction of the filament coil caused by distortion of its shape. It is
near impossible to load a sample manually without touching the DEP filament
coil with the syringe needle and therefore distorting its shape. With the
AutoProbe and the automated syringe injection, the DEP filament coil is
never touched by the syringe needle during sample introduction. As a
result, the DEP filament coil's geometry does not change with repeated
injections.
DEP filament life will be shortened by high current. In our studies, we did
not take the DEP filament coil over 1000 mA (1.0 amp). At this current, the
filament is glowing red and has an estimated surface temperature of at
least 1000 degrees C. This should be sufficient temperature to not only
analyze most samples, but is sufficient temperature to thoroughly clean the
DEP filament coil. As shown in the studies above, we saw no memory effects
from previous samples when the filament was used under these
conditions.
In the previous two weeks, we have analyzed over 2800 samples with the same
DEP filament coil, and we expect the life of the filament to continue for
some time.
Seal Life
The seals for the probe shaft are composed of PTFE. We have found this
probe seal design to be superior to other seal designs including the spring
loaded probe seal used by several mass spectrometer manufacturers. SIS has
been using this style of probe seal for more than 20 years in the design of
all our MS probes. Previous testing has determined that the life of these
seals should exceed 2000 injections. This is due to the large surface area
of the seals in contact with the probe rod. To date we have tested these
seals with more than 2500 injections of the probe without significant
leakage. Further testing of the AutoProbe will continue to determine the
true life of these seals.
When a leak at the probe seals does occur, the AutoProbe isolation valve
contains a vacuum gauge between the probe seals and the ball isolation
valve to detect any leak. When a leak is detected, the analysis is stopped
for this sample as well as any subsequent samples until the source of the
leak has been repaired. The probe seals can easily be replaced with a seal
removal tool included with the AutoProbe.
Conclusion
A DEP Probe system has been developed that is completely automated and
computer controlled. The software to control the automated probe is fully
integrated into the mass spectrometer software to provide for a seamless
probe-mass spectrometer operation package. The result of this design was an
automated MS DEP probe which can analyze samples quantitatively and
continuously at a rate of 2 to 5 minutes per sample. In addition the
technique has proven to be easily used in an Open Access
environment.
The major features of the AutoProbe are as follows:
- Automated Direct Probe for continuous analysis of samples
- Uses Direct Exposure Probe (DEP) Technology
- CTC PAL Autosampler loads liquid samples onto probe tip
- Can run up to 500 samples per day unattended
- Samples analyzed at the rate of 2 to 5 minutes per sample
- Plug in replaceable DEP probe filaments
- Long life probe tip filaments with expected life > 2000
samples
- DEP filament heated at a constant current or it can be programmed
in up to three programmable current run ramps
- High temperature bakeout of DEP filament between
samples
- Fully integrated with the ThermoQuest Xcalibur software
- Can be used in Open Access Mode of Operation
- Long life probe seals ( > 2000 injections)
- Probe Seals are easily replaced by user
- Automated vacuum lock isolation valve
- Vacuum gauge measures vacuum in isolation valves to eliminate
insertion of probe into source if seals are leaking
- Sequence stop if leaks, broken filament or other problems
occur
- Probe method stored as part of the Xcalibur sample method
- Can use different methods for subsequent samples in a sequence