- ▶
- Heaters/Source
- ▶
- Agilent Heaters and SensorsMass Spectrometry, Scientific Supplies & ManufacturingScientific Instrument Services 5973 Source Heater Tamper Resistant Allen Wrench 5973/5975 Quad Sensor 5985 Source Heater Assembly Agilent Interface Heater Assembly 5971 Interface Heater

- ▶
- LiteratureApplication Notes Adsorbent Resins Guide Mass Spec Tips SDS Sheets FAQ MS Calibration Compound Spectra Manuals MS Links/Labs/ Organizations MS Online Tools Flyers on Products/Services Scientific Supplies Catalog About Us NextAdvance Bullet Blender® Homogenizer Protocols Micro-Mesh® Literature Instrumentation Literature Agilent GC/MS Literature SIS News / E-Mail Newsletter NIST MS Database - Update Notifications

- ▶
- MS Online ToolsIsotope Distribution Calculator and Mass Spec Plotter Mass Spectrum Generator Exact Mass Calculator, Single Isotope Version SIS Online GC Chromatogram and Mass Spectrum Viewer Search NIST 23 MS Databases Mass Spec Calibration Compounds and Spectra Exact Masses of the Elements and Isotopic Abundances
- ▶
- Isotope Distribution Calculator and Mass Spec Plotter (This Page)

 We repair or replace old MS filaments
 Inland 45 and Other Vacuum Oils
 NIST 14 MS Library - Identify Mass Spectra
 Electron Multiplier for Agilent 5973 (many more available)
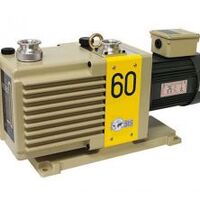 Rotary vane or dry pumps, including affordable SIS pump
 Syringe Pumps by New Era, low cost
 Micro-Mesh® cushioned abrasives for superior finishes
 SIS All-in-One Vacuum Filter Kits
 Agilent IDP-3 Dry Pump - for 5973/5975/5977 MSD, no more oil
 Ion Gauge Tubes for Agilent 597X and others
 Expert MS Source Cleaning Service by SIS
Description
Overview
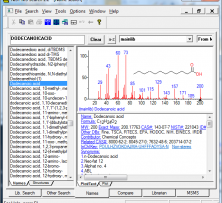
This program can calculate the isotopic distribution of a given chemical species. It can also plot either calculated or manually inputted isotopic distributions.
This program has been developed by Scientific Instrument Services as part of the Mass Spec Tools Collection. If you have any comments or suggestions we would like to hear from you.
Instructions
Key in the chemical formula for which you would like to determine the isotopic distributions. Also type in the titles and the mass scale range which will be present in the final graphical output. You have the option of calculating the masses in low resolution or high resolution.
Example Chemical Formulas:
CH4(CH3)2CHCH(CH3)2C10H22C6H5Cl(CH3)2C6H4
Calculation should take upwards of a few seconds depending on the size of the chemical species.
The species is assumed neutral (mass of added/removed electrons and binding energy is not taken into account), which can have an affect on the high resolution methods.
These isotopes are supported:
- Hone (for 1H)
- Htwo (for 2H)
- Hthree (for 3H)
- Ctwelve (for 12C)
- Cthirteen (for 13C)
- Cfourteen (for 14C)
- Nfourteen (for 14N)
- Nfifteen (for 15N)
The Formula can input using the standard one or two letter chemical symbols, number of atoms and parenthesizes where applicable. The same atom can be listed more than once and where no quantity is listed it is assumed to be 1. The following examples are all valid:
- C6H6
- C6H5Cl
- CHCl3
- (CH3)2CH2CH2(CH3)2
- CH3C6H12CH3
- COOHCHCH3NH2
- Molecular formula of the compound of interest according to the above parameters
- The title and subtitle that will appear on the graphical output
- The mass scale desired in the graphic output. Both low and high mass ranges can be selected. default is 0 and 600.
- The user also has the option of analyzing the data in low (unit mass resolution) or high mass resolution.
- Low mass resolution outputs results in unit mass resolution
- High resolution reports data in x.xxxx digit resolution, which prints out M+1 isotopes separately
The program calculates the exact molecular formula and molecular weights and the isotopic distributions of the molecules. It displays the data in tabular format. It then produces a screen with the numeric data and a graphical presentation of the calculated masses and their relative occurrences. The program is based on the binomial theorem for the calculation of the isotopic distributions of the mass distributions. The accuracy of the relative intensities is estimated to be within 1% of the actual value.
The calculations are performed on our compute server. This receives your data, performs the calculations and then returns the data back to your browser as described above. The time for the analysis and calculation of your formula is dependent on the size of your molecule and the number of atoms that are to be calculated. Since the binomial theorem is used the calculations can become quite long with large molecules. Time for analysis can very from 10 seconds to a minute or more for large molecules.
Developed by John
J. Manura and David J. Manura,
© 1996-2016 Scientific Instrument Services. All rights reserved.
This program or any of its parts may not
be reproduced on another site without the consent of Scientific Instrument
Services.
Scientific Instrument Services is not
responsible for any errors which may result from the use of this program.
This program has been produced by Scientific Instrument Services for
use by the scientific community.
Other mass spectra tools
SIS also sells the Mass Spec Calculator Pro™, a standalone Windows application. Unlike the online calculator, you are not as limited to the size of compounds that may be calculated. A demo may be downloaded.
- Molecular drawing, fragmentation, and auto-fragmentation
- Enhanced Isotopic Profile utility based on a completely new algorithm that calculates isotopic mass distributions for a structure.
- Elemental Formula utility calculates the possible compositions of an ion given its mass.
- Spectrum Capture utility that can automatically digitize a scanned spectrum and import it for use within MSC.
Isotope distributions can also be calculated using the Isotopes Calculator in the MS Interpreter tool in the NIST Mass Spectral Database.
Program Design
This program consists of several modules to calculate the molecular weights and isotopic distributions of the molecular formula input by the user.
mass10 - Main Control Program - This program is written provides the following functions:
- Provides the HTML code to produce the main screen and graphs
- Provides the form from which the user inputs, including molecular formula to be analyzed, mass range for display, high or low mass resolution, and same name to display in graphical output.
- Receives and parses the data input by the user
- Calculates the scalar values to produce the graphic output
- Scales the data to produce the desired X scale of the mass spectrum
- Submits the data to the routine to calculate the isotopic abundances
- Submits the data to the routine to produce the PNG graphic output file
- Prints the final display of all the data for viewing, update or reevaluation
- Plots graph
- Receives the raw data from the main program
- Checks the formula for validity and errors (number of parenthesis, elements and incorrect input)
- Removes the parenthesis
- Calculates the molecular formula
- Selects if data is to be determined in high or low resolution
- Reads in Element masses, isotopes and relative intensity values to be used in the calculations
- Uses the binomial theorem to calculate the isotopic distribution of all ions and masses
- Determines the most abundant ion
- Normalizes the data to the most abundant ion
- Rounds off mass intensities to the nearest 0.1 percent intensity
- Sorts data in relative intensity order
- Outputs data back to the main program
General Information
This program is improved over time to add more features and versatility. If you have any suggestions, we would like to hear from you.
Changes
- 2015-10-06: Ca44 abundance fixed from 20.86% to 2.086%
- 2015-06-29: Slightly larger computations supported (moved to new server).
- 2012-03-26: Molecule size limits have been increased.
- 2012-03-26: Internal changes: Code has been reimplemented but same algorithms kept. Speed and memory usage have improved.
- 2012-03-23: Added Ctwelve.
- 2009-10-13: Rounding change: abundances now round to nearest (not round down)
- 2009-10-12: Added support for some labeled isotopes (e.g. Dtwo and Dthree -- see above)
- 2000-02: Low resolution has been enabled again since we have corrected a roundoff (typically off-by-one) error that was occurring in low-resolution calculation of certain combinations of larger atoms (such as Rh). Low resolution now uses the same underlying algorithm as does high resolution. The "low resolution fast approximation" option uses basically our previous low-resolution algorithm, except that the accuracy has been increased by a factor of 10; nevertheless, some roundoff may occur in large molecules. However, for large molecules, the fast approximation algorithm is orders of magnitude faster than the standard algorithm.